Article Text

Abstract
Objectives Decreased gut microbial gene richness (MGR) and compositional changes are associated with adverse metabolism in overweight or moderate obesity, but lack characterisation in severe obesity. Bariatric surgery (BS) improves metabolism and inflammation in severe obesity and is associated with gut microbiota modifications. Here, we characterised severe obesity-associated dysbiosis (ie, MGR, microbiota composition and functional characteristics) and assessed whether BS would rescue these changes.
Design Sixty-one severely obese subjects, candidates for adjustable gastric banding (AGB, n=20) or Roux-en-Y-gastric bypass (RYGB, n=41), were enrolled. Twenty-four subjects were followed at 1, 3 and 12 months post-BS. Gut microbiota and serum metabolome were analysed using shotgun metagenomics and liquid chromatography mass spectrometry (LC-MS). Confirmation groups were included.
Results Low gene richness (LGC) was present in 75% of patients and correlated with increased trunk-fat mass and comorbidities (type 2 diabetes, hypertension and severity). Seventy-eight metagenomic species were altered with LGC, among which 50% were associated with adverse body composition and metabolic phenotypes. Nine serum metabolites (including glutarate, 3-methoxyphenylacetic acid and L-histidine) and functional modules containing protein families involved in their metabolism were strongly associated with low MGR. BS increased MGR 1 year postsurgery, but most RYGB patients remained with low MGR 1 year post-BS, despite greater metabolic improvement than AGB patients.
Conclusions We identified major gut microbiota alterations in severe obesity, which include decreased MGR and related functional pathways linked with metabolic deteriorations. The lack of full rescue post-BS calls for additional strategies to improve the gut microbiota ecosystem and microbiome–host interactions in severe obesity.
Trial registration number NCT01454232.
- intestinal tract
- intestinal bacteria
- gastric surgery
- obesity
- obesity surgery
Statistics from Altmetric.com
Significance of this study
What is already known on this subject?
Moderate obesity is characterised by decreased microbial gene richness (MGR) (20%–40% of the patients) associated with altered metabolic risk and a shift in metagenomic species (MGS) signature.
This has not been explored in severe obesity.
Some studies with limited number of subjects showed changes in the gut microbiota, but none explored precisely MGR and combined related metagenomics and metabolomics signatures after 6 months of follow-up.
What are the new findings?
This is the first comprehensive study performed in severe obesity demonstrating a very high prevalence of patients (75%) with decreased MGR, which associates with overt metabolic complications.
We describe novel metabolomic and MGS signatures that are specific to decreased MGR found in severe obesity.
Bariatric surgery (both adjustable gastric banding and Roux-en-Y-gastric bypass (RYGB)) improves MGR, but it is partially restored in most patients, and most remain with low MGR despite major metabolic improvement and weight loss in all patients.
Clusters of metabolites (such as glycine, acetylglycine and methylmalonate) increasing post-RYGB were linked with improved body composition.
Importantly, even longer periods post-RYGB (ie, 5 years) do not further increase MGR.
How might it impact on clinical practice in the foreseeable future?
Our results question whether specific interventions (specialised diets, prebiotics/probiotics or gut microbiota transfers) may be useful to consider prior or post bariatric surgery in severely obese individuals in order to further improve MGR and metabolic health postbariatric interventions.
Introduction
Among the complex obesity causes1 and its related diseases2 (type 2 diabetes (T2D) and cardiometabolic diseases), the gut microbiota appears to be a relevant contributor and is likely a pivotal factor between changes in lifestyle and host biology (for review, see ref 3). Gut dysbiosis was identified in overweight and moderate obesity,4 5 as evidenced by substantial modifications in the gut microbiota composition (with enrichment or decrease in specific bacterial groups) and low microbial gene richness (MGR),4 5 which are associated with metabolic alterations (insulin resistance, low-grade inflammation and adipocyte hypertrophy).4 5 However, gut microbiota characteristics have been scarcely explored in extreme forms of obesity, although severe (body mass index (BMI) >35 kg/m²) and morbid obesity (BMI >40 kg/m²) have progressed worldwide, reaching 2.3% and 5% in men and women, respectively. While some severely obese patients remain metabolically healthy,6 in general, reaching a BMI >35 kg/m² induces a significant rise in chronic disorders.1 Furthermore, healthy obese individuals often develop metabolic alterations and comorbidities with time.6
Furthermore, severe/morbid obese individuals represent the only eligible candidates for bariatric surgery (BS), a treatment which has dramatically increased worldwide7 as it reduces cardiovascular risks and improves metabolic conditions.8 BS represents a good model to understand the intestinal contribution to health improvements by comparing adjustable gastric banding (AGB), a procedure solely inducing caloric restriction due to gastric volume reduction (equivalent to a successful diet intervention), and Roux-en-Y-Gastric bypass (RYGB), which by contrast drastically rearranges the digestive tract architecture and adds intestinal malabsorption to food intake reduction.9 MGR is modulated by dietary interventions and increased by 30% after a short-term dietary restriction (with fibre enrichment) in overweight/moderately obese individuals.5 Few studies addressed microbiota evolution using whole shotgun metagenomics (WGS)10–12 in paired subjects followed at several time points post-BS. Particularly, MGR evolution post-BS as well as its relation with other characteristics (clinical improvements or systemic metabolomics) have been scarcely assessed. Importantly, 50% of these beneficial associations depend on post-BS dietary modifications,13 therefore confirming the need to compare microbiota modifications after different BS techniques, namely AGB and RYGB, where food reduction in terms of total calorie does not differ.14
Herein, we used WGS and aimed to examine (1) whether MGR worsens in severe obesity and how it relates to aggravation of comorbidities, and (2) whether different BS types could differentially correct severe obesity-related gut microbial characteristics, including changes in MGR, composition and function.
Materials and methods
Clinical cohorts
We prospectively included 61 severely obese women (Microbaria (MB) at Pitié-Salpêtrière Hospital Obesity Unit, Paris) (figure 1A), as described.15 Patients were assigned for AGB or RYGB following international BS guidelines (ie, BMI ≥40 kg/m² or ≥35 kg/m² with at least one severe obesity-related comorbidity) and patients’ preferences, a decision subsequently validated by a multidisciplinary panel. RYGB was frequently chosen for more severely diseased individuals.
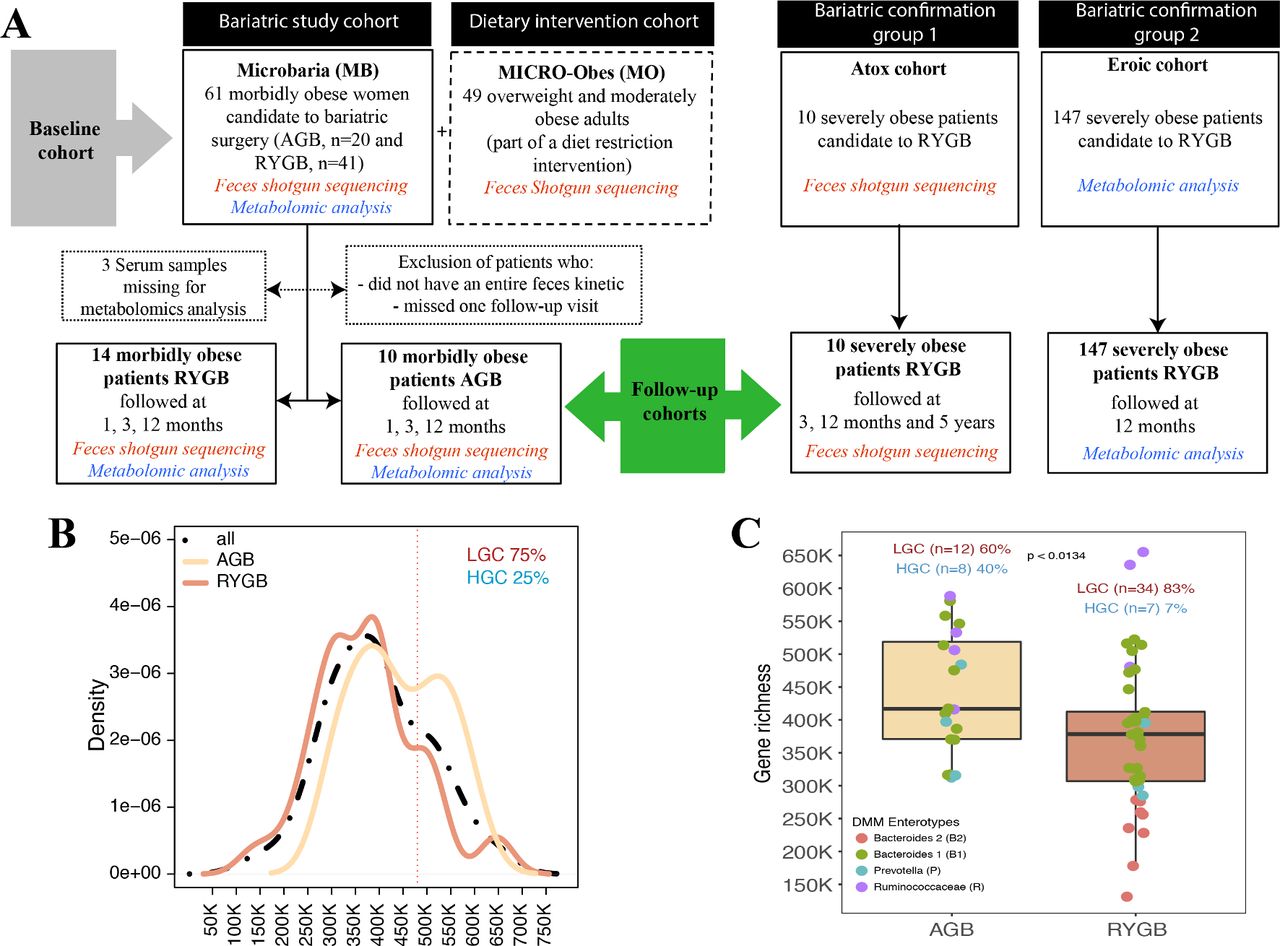
MGR in severe obesity. (A) Study flow chart: baseline (MB or MB+MO) and MB follow-up cohorts. Two independent confirmation cohorts (EROIC and ATOX) were used for data confirmation. (B) MGR bimodal distribution in the MB baseline cohort. (C) Baseline MGR in AGB and RYGB patients, including four enterotype characteristics in each surgery group. AGB, adjustable gastric banding; HGC, high gene count; LGC, low gene count; MB, Microbaria; MGR, microbial gene richness; MO, MICRO-Obes; RYGB, Roux-en-Y-gastric bypass.
Clinical, anthropometric and biological evaluations were obtained at baseline (T0) and during follow-up at 1 month (T1), 3 months (T3) and 12 months (T12) post-surgery.16 T2D, glucose intolerant status and dyslipidaemia status (definitions in the online supplementary materials and methods) were acknowledged. Dual X-ray absorptiometry estimated the body composition (Hologic Discovery W, V.12.6 software, 2; Bedford, Massachusetts),16 which included total fat-free mass, total-fat mass, trunk-fat mass (all in kilogram or %) and gynoid-fat partitioning. Patients filled in the questionnaires to record general health, medications, birth mode and the Bristol Stool Scale (BSS). Blood samples were collected after a 12-hour overnight fast at all described time points to measure biochemical parameters using routine techniques for glucose homeostasis and lipid profiles. An oral glucose tolerance test (OGTT) was performed in a subset of patients (n=21, 34%) at T0 to assess glucose and insulin area under the curve (AUC), and the Stumvoll Index was used to characterise glucose tolerance.17 All patients undergo the same preparation pathway that lasts on average 6–12 months, where they initially are advised to have an equilibrate diet. On average their T0 visit was performed 3 months prior to their surgery. We do not advise them to modify their diet or undergo weight loss, but rather stabilise their weight.
Supplemental material
Faeces were collected at each visit using a standardised method.18 No patients had received antibiotic treatment for 3 months pre-BS, nor had any history of acute or chronic GI diseases. All subjects signed the informed written consent and the protocol was registered at ClinicalTrial.gov (NCT01454232).
To examine gut microbiota across a broader range of BMI and metabolic complications, we used the previously described5 MICRO-Obes (MO) cohort (figure 1A), similar in age and composed mainly of women (84%), who are overweight/moderately obese patients without T2D or any medical treatment. Two confirmation and independent cohorts were added, including patients with severe obesity undergoing RYGB. A group of 10 severely obese individuals (ie, ATOX cohort) who underwent RYGB were further followed at T0, 3, 12 months and 5 years after their surgery, for whom we sampled faeces and performed WGS to analyse MGR and metagenomic species (MGS)-associated signatures. This cohort was initially designed for characterisation of longer term microbiota evolution. Therefore, we had access to only four patients at 1 year and the whole group at 5 years. Another independent confirmation cohort of 147 severely obese individuals (ie, EROIC cohort: 64 patients with T2D and 83 obese non-T2D patients) were followed at T0 and 12 months post-surgery and for whom we sampled blood and performed metabolomics analysis (figure 1A).
MB, ATOX and MO gut microbiota were sequenced using the same WGS methodology and bioinformatics processing. Similar clinical phenotyping were also acquired in both cohorts.
Gut microbiota analysis by quantitative metagenomics
Participants collected faecal samples in two 20 mL tubes within 24 hours before each visit. Samples were either stored immediately at −80°C or briefly conserved in home freezers, in anaerobic conditions, before transport to the laboratory where they were immediately frozen at −80°C following guidelines.18
The total faecal DNA from 182 MB samples was extracted, sequenced and analysed. DNA extraction used quenching solutions to protect DNA from degradation by DNases and a bead-beating step that ensures the lysis of particularly robust cells.19 20 A barcoded fragment library was prepared for each sample and DNA sequencing data were generated using SOLiD 5500xl sequencers. An average of 68.72 million 35-base-long single reads (SD 26M) were obtained for the samples. The same methodology also applies for ATOX.
Primary analysis, from reads quality cleaning to read mapping over a 3.9 million gene reference catalogue,21 was performed using Meteor Studio.5 Secondary analyses, from gene abundance normalisation to MGS projection,21 and statistical analysis were performed using the momr R package. The online supplementary materials and methods describe in detail the bioinformatics processing.
Serum metabolomics
Serum metabolomics were performed for 58 MB patients at baseline (figure 1A). Serum samples were extracted using cold acetonitrile containing labelled mix of 16 amino acids at 12.5 µg/mL and processed as described in the online supplementary materials and methods.
LC-MS analysis was carried out on a UPLC Waters Acquity (Waters, Saint-Quentin-en-Yvelines, France) coupled to a Q Exactive (Thermo Fisher Scientific, Illkirch, France). Chromatographic conditions were adapted to screen microbiota-derived metabolites as described.22 Data were curated, normalised and annotated, yielding 242 different metabolites. Details about preprocessing and processing steps are reported in the online supplementary materials and methods.
Statistical analyses
Statistical analyses were performed on R using public and inhouse packages. Non-parametric statistics were performed when variables displayed non-normality. All tests were corrected for multiple testing using Benjamini-Hochberg. Results were considered significant at an false delivery rate (FDR) <5% (unless specified otherwise). Paired testing was performed for comparing samples across time. Graphics were built using R core and ggplot plots.
Results
Gut microbiota richness and clinical phenotypes in severe obesity
In 61 obese women (MB) with BMI >35 kg/m², MGR exhibited a bimodal distribution.4 5 Using the same methodology and gene cut-off (480 000) as previously4 5 to create low gene count (LGC)/high gene count (HGC) classes, the vast majority of patients (75%) belonged to the LGC group (figure 1B), a dramatic increase compared with overweight/moderate obesity.4 5 At baseline, RYGB and AGB patients had similar overall clinical characteristics and BMI, except for increased DEXA-quantified trunk-fat mass and prevalence of obstructive sleep apnoea in RYGB patients (online supplementary table 1). MGR was significantly higher in AGB patients compared with RYGB patients (p=0.013) (figure 1C).
Supplemental material
LGC inversely correlated with metabolic alterations: triglycerides (p=0.049), uricaemia (an indirect insulin resistance marker, p=0.038), and systemic inflammation markers fibrinogen (p=0.048) and neutrophil count (p=0.042) (online supplementary table 2).4 5 Beyond previous findings, MGR was identified to be inversely correlated with detrimental body composition (ie, trunk-fat mass (r=−0.27 p=0.04)) and was significantly decreased in patients with T2D (p=0.014), as compared with normoglycaemic patients. The MB cohort included nine patients with T2D (among the 61) and eight of them were on metformin treatment, the first treatment given to control glucose homeostasis, as recommended by the international recommendations for T2D therapy.23 The only one without metformin did not need any antidiabetic drugs to remain below the target of HbA1c of 6.5%. MGR decreased in patients with elevated blood pressure (p=0.05), and we observed a trend (p=0.058) towards more features of metabolic syndrome (International Diabetes Federation (IDF) definition) in LGC patients (online supplementary table 2). The BSS revealed that softer stools were associated with decreased MGR (p=0.005, r=−0.42) (online supplementary table 2). We did not observe any effect of birth mode (vaginal or C section), proton pump inhibitor (PPI) use or smoking on MGR.
Supplemental material
To gain further insight into the microbiome composition in addition to MGR, we used the dirichlet multinomial mixtures (DMM) approach of Holmes et al 24 to characterise the enterotype composition of the MB cohort. We herein showed the presence of the same four enterotypes described recently25 explaining 40% of the variation in microbiome composition (R2=0.4; permutational multivariate analysis of variance (PERMANOVA) tests) (online supplementary figure 1), yet there was no significant association of enterotype composition and BSS at baseline (Fisher’s test p=0.97 (AGB) and p=0.57 (RYGB)). Interestingly, we observed that patients with the B2 enterotype were those with the lower MGR, whereas those with the Ruminococcaceae enterotype (although few in numbers) were indeed those with the higher MGR. B2 enterotype was mostly observed in patients with T2D at baseline.
Supplemental material
Gene richness worsens with aggravated obesity
We further aimed to gain insight of MGR in a broader BMI range spanning overweight to morbid obesity by examining its distribution and bioclinical relationships. For this, we pooled clinical information from the MB and MO (overweight/moderate obesity) cohorts examined in our centre5 (figure 1A). Compared with MO patients, the MB patients were younger, all women who displayed worse body composition (ie, increased total-fat and trunk-fat mass) and had more frequent cardiometabolic complications: T2D, hypertension (HTA), increased insulin resistance (at fasting and during the OGTT), and increased C reactive protein (CRP) and interleukin-6 (IL6) (table 1).
MB and MO patients’ baseline clinical characteristics
In the entire population (MB+MO, n=110 subjects, BMI (26–61 kg/m²), fat-mass (16.5–81 kg)), MGR was inversely correlated with fat-mass (p=0.0002), leptin (p=0.0072), fasting insulin (p=0.00019), homeostatic model assessment insulin resistance (HOMA-IR) (p=0.00005), triglyceride levels (p=0.0024) and systemic inflammation (IL6 and CRP (p=0.019 and p=0.038)). MGR decreased from MO to AGB to RYGB patients, respectively, and was significantly and inversely correlated with BMI, total-fat mass and trunk-fat mass (Figure 2A), and positively associated with gynoid-fat distribution (p=0.037). MGR decreased with HTA and its severity (evidenced by drugs number to achieve normal blood pressure), glucose intolerance and T2D (Figure 2B). MGR negatively correlated with glucose intolerance-related parameters (OGTT glucose AUC and OGTT Stumvoll Index) and subcutaneous adipocyte volume, and positively associated with adiponectin (Figure 2C). There was no gender effect on MGR, confirming previous observations.4 5

Links between MGR and bioclinical characteristics in MO+MB subjects. (A) MGR relationships with anthropometric parameters. (B) MGR relation with metabolic comorbidities (hypertension and hypertension treatments and diabetes); N, non-diabetes; IG, glucose intolerance; D, diabetes. (C) MGR relation with OGTT-derived glucose tolerance parameters (AUC of glucose after OGTT with 75 g glucose and Stumvoll Index), adiponectin and adipocyte volume. Pearson’s correlations are performed (p=p value, q=FDR and r2; statistics include linear models (lm), Pearson’s and Spearman’s correlations, t-test and Kruskal-Wallis when appropriate. AGB, adjustable gastric banding; AUC, area under the curve; DXA, X-ray absorptiometry; MB, Microbaria; MGR, microbial gene richness; MO, MICRO-Obes; OGTT, oral glucose tolerance test; RYGB, Roux-en-Y-gastric bypass.
Among these subjects, we considered all 786 MGS, which represent coabundant groups of genes with at least 500 genes as described.21 The association between corpulence and the gut microbiome was also observed at the level of MGS abundance with a principal coordinates analysis (PCoA) analysis. The first two principal components described 23% of the total variance and the second component mostly associated with MGR (online supplementary figure 2A,B), which demonstrates important ecosystem differences according to the degree of obesity and richness. From overweight to morbid obesity, the loss of MGR is linked with adverse body composition, adipocyte hypertrophy and overt metabolic complications.
Supplemental material
Richness-linked metagenomics species associate with metabolic deteriorations in severe obesity
We examined whether some of the 786 MGS21 were specifically associated with parameters linked to clinical phenotypes in severe obesity. Out of this list, about 29% (n=226) significantly associated with MGR (FDR<0.05). We focused on the most MGR-correlated MGS (n=78 with FDR<0.001; figure 3A and online supplementary table 3), of which only 18 were previously found associated with LGC4 in less obese individuals. Whereas the vast majority of these 78 MGS associated positively with MGR (r>0.47), three correlated negatively (r<−0.51); 19 of them were annotated at the species level. Enrichment analysis (Fisher’s test), compared with the overall MGS catalogue (n=786), indicates Firmicutes (FDR<6.7e-05) as the most prevalent phylum associated with MGR and Clostridiales most prevalent at the order level (FDR<5.5e-06). Importantly, we confirmed this MGS signature of low MGR in the ATOX independent cohort composed of severely obese individuals who underwent RYGB (figure 1A). Most of these MGS (50/78) associated with low MGR (online supplementary figure 3). We also confirmed the significant association between low MGR and increasing BMI, and trunk-fat mass. Likewise, MGR was significantly lower in patients with comorbidities (T2D, HTA, use of antihypertensive drugs) (data not shown).
Supplemental material
Supplemental material
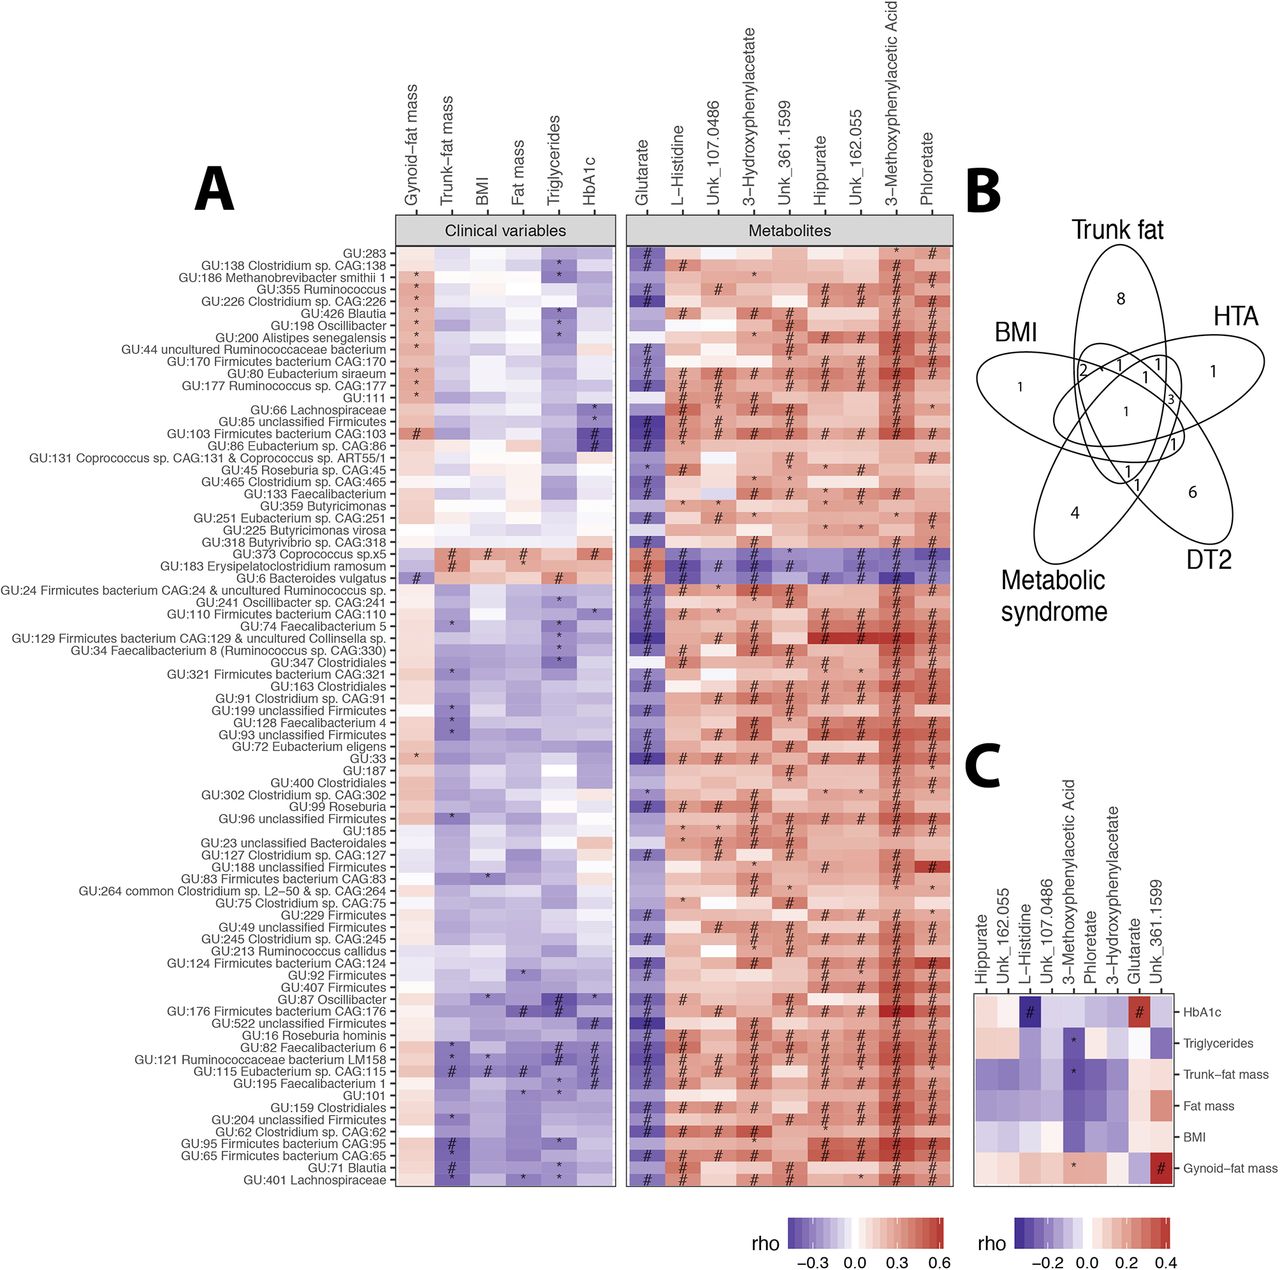
MGR-associated MGS at baseline. (A) Heatmap of Spearman’s pairwise correlation coefficients between MGR-associated MGS abundance and metabolic variables (body composition and corpulence and metabolic traits) and MGR-associated serum metabolites. (B) Venn diagram of metabolic parameters associated with MGR-related MGS. (C) Heatmap of Spearman’s pairwise correlation coefficients between metabolic phenotypes and targeted serum metabolites. P value significance denoted by * and FDR significance by #. BMI, body mass index; HbA1c, haemoglobin A1c; HTA, hypertension; MGR, microbial gene richness; MGS, metagenomic species.
We found relevant associations between these 78 MGR-linked MGS and clinical variables (online supplementary table 3): five and seven MGS were significantly associated with BMI and fat-mass, respectively (two of them resisted multiple testing: GU:373 Coprococcus_sp5 and GU:115 Eubacterium_sp_CAG_115). Sixteen MGS were associated with trunk-fat distribution, including the two BMI-associated MGS, GU:373 Coprococcus_sp5 and GU:115 Eubacterium_sp_CAG_115 (figure 3A), and a few were associated with either T2D, HTA or metabolic syndrome, as shown in figure 3B.
Looking at the overall patterns of MGS–phenotype associations, we observed relevant MGS subset positively associated with metabolic parameters and corpulence traits, such as total and trunk-fat mass, triglyceride and haemoglobin A1c (Hba1c) (which included GU:6 Bacteroides vulgatus, GU:183 Erysipelatoclostridium ramosum and GU:373 Coprococcus_sp5, the latter was also associated with a cluster of clinical comorbidities (metabolic syndrome, HTA, T2D)), and one cluster negatively associated with BMI, total-fat and trunk-fat, triglycerides and Hba1c (GU:115 Eubacterium_sp_CAG_115, GU:121 Ruminococcaceae bacterium and GU:82 Faecalibacterium_6) (figure 3A). Five MGS from the Firmicutes phylum were associated with three distinct metabolic alterations (T2D, metabolic syndrome and HTA), namely GU:373 Coprococcus_sp5, GU:195 Faecalibacterium 1, GU:66 Lachnospiraceae, GU:82 Faecalibacterium 6, GU:86 Eubacterium sp CAG:86 and GU:163 Clostridiales (online supplementary table 3). Despite its smaller sample size, we observed similar trends of associations, in the confirmation cohort (ATOX group), between MGR-linked MGS and metabolic clinical variables: GU:6 Bacteroides vulgatus was positively associated with Hba1c (online supplementary figure 4).
Supplemental material
In severe obesity, among the most MGR-linked MGS, 50% are associated with metabolic variables, among which 20.5% are associated with both adverse body composition and metabolic alterations.
Metabolites associated with MGR and related bacterial functions
At baseline, we identified nine serum metabolites (4% of the measured metabolites) significantly associated with MGR (Spearman’s correlations, FDR<0.05) (online supplementary table 4 and online supplementary figure 5). One metabolite (glutarate) correlated negatively (r=−0.4; p<0.0017) while eight metabolites (3-methoxyphenylacetic acid, phloretate, hippurate, 3-hydroxyphenylacetate, L-histidine and three unknown) correlated positively with MGR (0.4<r<0.66). These metabolites were strongly associated with MGR-linked MGS (figure 3A). 3-Methoxyphenylacetic acid displayed the strongest correlation, particularly with the MGS GU:6 B. vulgatus, GU:183 Erysipelatoclostridium ramosum and GU:373 Coprococcus_sp5.
Supplemental material
Supplemental material
We defined functional modules containing protein families from the KEGG repository involved in the above-cited metabolites metabolism. These modules were projected on targeted MGS based on functional annotations of the 3.9M gene catalogue.21 These projections showed functional linkages of target MGS with glutarate, hippurate and L-histidine. The enzyme succinate-semialdehyde dehydrogenase/glutarate-semialdehyde dehydrogenase (K00135), which oxidises glutarate-semialdehyde to glutarate, was encoded in only 3 out of 75 positively MGR-linked MGS. GU:347 encodes two of the enzymes involved in D-lysine degradation to ketoadipate (K00128, K00832), which can be channelled to acetyl-CoA through decarboxylation to glutarate according to C-13 labelling experiments in Pseudomonas putida.26 27 Nine MGS among the 78 MGR-linked MGS encode for the hippurate hydrolase enzyme, which is responsible for hippurate degradation to glycine and benzoate. Among these, two of the three MGS were negatively associated with MGR (GU:183 and GU:373). Under the assumption of a microbial origin of hippurate, this result, together with the positive association of hippurate serum levels with MGR, would be in line with a role of these MGS in lowering hippurate in LGC patients. The most complete functional profile was observed for L-histidine biosynthesis (eight target MGS having the complete pathway) and degradation (eight target MGS having three out of four KOs of the pathway) (online supplementary figure 6).
Supplemental material
Looking at the associations with clinical variables, 3-methoxyphenylacetic acid positively correlated with gynoid-fat distribution and negatively with trunk-fat mass and triglycerides. L-histidine was decreased in patients with HTA and/or metabolic syndrome (online supplementary table 4). Glutarate was increased with higher HbA1c, as well as in patients with diabetes and in glucose-impaired patients (figure 3C). Overall, we show novel relationships between low MGR, related MGS, systemic metabolite concentrations and related MGS metabolite pathways in severe obesity.
Partial microbial recovery postbariatric interventions
We investigated whether MGR would change post-BS in a patient subset from the MB cohort (10 AGB and 14 RYGB) with follow-up at 1, 3 and 12 months post-BS (figure 1A). This subset had similar clinical characteristics compared with the 61 patients at baseline (online supplementary table 1, right) and improved MGR post-BS (table 2). RYGB patients improved their body composition, metabolic and inflammatory profiles more so than AGB patients (table 2) 1 year post-BS.28
Follow-up clinical characteristics of evolution after RYBG and AGB
MGR increased from baseline as soon as M3, and reached statistical significance at M12 in both surgeries (figure 4A,B). Despite greater metabolic improvement post-RYGB than post-AGB, MGR remained significantly lower in RYGB during the 1-year follow-up even at M12 (figure 4B,C). At baseline, RYGB patients had a more dysbiotic microbiome compared with AGB patients (average AGB-MGR=430 322 genes, SE=32 556; average RYGB-MGR=340 743, SE=30 347), and these differences were maintained at M12 (average AGB-MGR=526 922 genes, SE=19 899; average RYGB-MGR=418 822, SE=13 650) (figure 4B). This points to similar patterns of richness recovery after both surgeries (at M12, average MGR display a 1.39-fold and 1.27-fold increase post-RYGB and post-AGB, respectively), which was not significantly different between surgery groups (Wilcoxon p=0.86). We also observed interindividual variability in MGR evolution, with some patients remaining quite stable during the follow-up while others in either surgery group demonstrated a major increase (figure 4B). Baseline HGC patients remained stable or increased further post-BS. Four patients switched from LGC to HGC at M12 (three of whom were from the AGB group; 30%). All patients with T2D (receiving metformin at baseline) also increased their MGR postsurgery along the first year follow-up, with one patient remaining on metformin treatment until M3, thus suggesting that richness recovery post-BS is independent of metformin treatment (figure 4B). Importantly, we observed that most patients changed the enterotype composition after RYGB; in particular, most B2 patients at baseline switched to B1 enterotype (figure 4B).

Microbial composition postbariatric surgery. (A) Mean changes in MGR in RYGB and AGB from baseline to month 1 (M1), month 3 (M3) and month 12 (M12). (B) Evolution of richness and enterotype composition of 24 patients with kinetics follow-up at M1, M3 and M12. (C) MGR with enterotype distribution at M12 in AGB (n=10) and RYGB (n=14) patients with kinetics follow-up. (D) Richness evolution confirmed in another independent RYGB (ATOX) cohort followed at 5 years. *Significance between AGB and RYGB. *Significance between baseline and M12. AGB, adjustable gastric banding; MGR, microbial gene richness; RYGB, Roux-en-Y-gastric bypass.
The increase in MGR post-BS was confirmed in the independent bariatric group (ATOX). MGR increased from baseline to 1 year following a similar pattern as the MB patients. Most interestingly, MGR stabilised from 1 to 5 years post-RYGB, suggesting that the major gut microbiota modifications seen during the first year do not occur afterwards. Like in the MB patients, despite an increasing MGR, few patients switched to high MGR at 1 or 5 years (figure 4D).
At the ecosystem level, RYGB patients were more similar to each other than to AGB patients regardless of the time points (online supplementary figure 7A). For each patient, we computed the intrasubject similarity between all time points and unrelated samples (online supplementary figure 7A,B). BS modified the gut microbial ecosystem and these alterations occurred along the entire follow-up as seen by the trajectories from M1 to M12, which were significantly different between AGB and RYGB (p<0.013). RYGB altered the microbiome to a higher extent than AGB (lower intrasample similarity, p<0.001).
Supplemental material
Next, we examined the specific MGS changes. Among the 786 MGS described above, 11 and 2 MGS were significantly modified 12 months after RYGB and AGB surgeries (p<0.01), respectively; one of them (GU:225 Butyricimonas virosa) was altered by both interventions (figure 5A and online supplementary table 5). Among the 78 MGR-linked MGS, only 3 increased significantly (FDR<0.05) at M12 in the whole group (GU:99 Roseburia, GU:225 Butyricimonas virosa, GU:359 Butyricimonas) (online supplementary table 3), but none were significant when tested within each surgery subgroup. Importantly, 10 of the 11 MGS significantly modified post-RYGB in MB followed the same pattern in the ATOX confirmation cohort (online supplementary figure 8).
Supplemental material
Supplemental material

Significant MGS change postbariatric surgery. (A) 12 MGS significantly differ between baseline and T12 post both surgeries. Brown: RYBG (11 MGS); beige: AGB (2 MGS; 1 is common to RYGB-MGS). *Significant p value (in brown for RYGB and beige for AGB between T0 and T12). (B) Heatmap of Spearman’s pairwise correlation coefficients between MGS delta and improvement in clinical outcomes. *Significant p value; #significant FDR. AGB, adjustable gastric banding; BMI, body mass index; HbA1c, haemoglobin A1c; MGS, metagenomic species; RYGB, Roux-en-Y-gastric bypass.
Among these 12 MGS altered post-BS, we found significant relationships of their changes post-BS with the changes of clinical variables between M12 and baseline (figure 5B and online supplementary table 5). Half of these MGS were associated with at least two corpulence and body composition variables. Out of these species, GU:224 Hungatella hathewayi, GU:649 Fusobacterium nucleatum and GU:588 Dialister sp displayed the strongest negative associations with the change of BMI, gynoid or trunk-fat, while GU:203 Bacteroides finegoldii, GU:25 Anaerostipes hadrus and GU:235 Coprobacillus sp were positively related to the change of these phenotypes. The change of GU:224 Hungatella hathewayi also correlated with HbA1c levels and GU:235 Coprobacillus sp diminished with HTA resolution. Importantly, five of the baseline MGR-associated MGS changed post-BS.
Among the circulating metabolites, 30 were significantly modified post-BS at M12, with 50% decreased (mostly related to amino acid, branched-chain amino acid, phenylalanine and tryptophan pathway metabolites). Among these, only one (Unk_107.0486, still unknown) was significantly associated with MGR at baseline (online supplementary table 6, online supplementary figure 9). In our confirmation group (EROIC) (figure 1A), we could map 18 of the 30 annotated metabolites, significantly modified in the MB cohort. All followed a similar pattern post-BS in patients with or without T2D (online supplementary figure 10).
Supplemental material
Supplemental material
Supplemental material
The changes of these metabolites 1 year post-BS (MB group) significantly associated with changes in bioclinical parameters (mostly related to corpulence and body composition; online supplementary figure 11). We observed a cluster of metabolites (such as glycine, acetylglycine, methylmalonate) increasing post-RYGB that negatively and significantly correlated with the decrease in body corpulence and adipocyte diameter. The changes in methylmalonate and glycine were also significantly associated with the change of two BS-modified MGS (ie, GU:203 Bacteroides finegoldii and GU:235 Coprobacillus_sp), which were also associated with body composition improvement. In the EROIC confirmation cohort, we confirmed the same trends of associations between metabolites changes and improvement of clinical variables for the 18 mapped metabolites 1 year post-RYGB. Acetylglycine and glycine which increased post-BS were negatively associated with improved weight and body composition in both groups (online supplementary figure 12).
Supplemental material
Supplemental material
Discussion
Here, we report in severe obesity a major decrease in MGR associated with specific MGS-related signatures confirmed in two independent cohorts. We described related microbiome functional alterations and low MGR-related metabolomics signatures. We showed in severe obesity the presence of four enterotypes recently described in 40 individuals ranging from underweight to moderate obesity.25 Herein, very few severely obese patients harbour a Ruminococcaceae enterotype (ie, those who displayed the higher MGR). MGS associated with metabolic comorbidities at baseline were different from those significantly changing 1 year post-BS. Strikingly, despite major weight loss and metabolic improvements post-BS, low MGR was not fully rescued. MGR significantly increased after both surgery types, but most patients remained with low MGR at 1 year, the time where the improvements induced post-BS reach their peak. This phenotype remained similar even after 5 years. A switch of enterotypes was observed for many patients post-BS with a reduction of B2 enterotype associated with low bacterial load.25
Low MGR is much more prevalent (75% of patients displayed LGC) in severe obesity compared with lean or overweight/moderate obesity where LGC concerned 23%4 to 40%5 of subjects. Decreased MGR thus appears as a marker of disease severity as in inflammatory intestinal diseases. While confirming associations between LGC, altered metabolism and low-grade inflammation,4 5 we show new links between MGR and trunk-fat, a detrimental fat depot more strongly associated with cardiometabolic risks (in particular T2D status), than BMI per se.29 The negative association between MGR and adipocyte size further illustrates the interaction with adipose tissue phenotype similar to our reported link between decreased Akkermansia muciniphila and adipocyte hypertrophy.30 Since most patients with T2D included herein (8/9) received metformin therapy at baseline, we cannot disentangle the effect of the drug from that of T2D status on low MGR. Yet patients with T2D in our study received association of antidiabetic drugs, suggesting a more severe disease compared with subjects previously explored in Forslund et al’s and Wu et al’s studies, where the confounding effect of metformin on microbiota composition was investigated.31 32 However, in Forslund et al’s study,32 patients with or without metformin did not have any significant differences in MGR; therefore, we do not believe that the observed low MGR is drug-related but may be a marker of disease severity.
Vandeputte et al 25 reported that B2 enterotype was associated with decreased cell count, increased cell moisture and decreased gene richness. Here, we did not observe any relation between enterotypes and Bristol Stool Score linked to cell moisture, yet we observed an association between BSS and MGR as previously reported.33 We did not assess cell count, but interestingly B2 patients, being in the RYGB group, were those with the lowest MGR. Enterotypes could therefore be used as a proxy to cell count measures.25 Noteworthy, previous data showed that patients with severe obesity display slower (rather than increased) transit time,34 which is not modified after BS.35 BSS may be an indirect marker of intestinal inflammation as described previously by the association between increased BSS and calprotectin, an intestinal inflammatory marker.36 It is concordant with a previous work from our lab, where we demonstrated that severe obesity was characterised by increased intestinal inflammation as seen by the infiltration of immune cells in the jejunum as compared with lean individuals.37 Finally, this is also concordant with previous results where decreased MGR was observed in patients with BSS scores above 3, which herein concerns most of the MB cohort.38 We did not observe links with smoking, birth mode nor PPI as reported elsewhere, and we suggest that this may be due to the already very altered states of the microbiome in severely obese subjects.
Importantly, among 786 reference gene-catalogued MGS, one-third linked with MGR (among which n=78; 10%) were also highly associated with comorbidities, most of which seem to be a specific signature of severe obesity. Half were MGS associated with both trunk-fat mass and metabolic alterations, such as increased triglycerides and impaired glucose tolerance. Among the MGS grouped together using hierarchical clustering, one cluster, which included B. vulgatus, was strongly and positively associated with adverse metabolism, confirming findings linking B. vulgatus and insulin resistance.39 In obese women treated with prebiotics, B. vulgatus decreases along with fat-mass reduction and improved glucose homeostasis.40 Increased B. vulgatus induces adverse health outcomes such as colitis in rodents.41 B. vulgatus is enriched in patients with active Crohn’s disease42 and induces the production of a glycoprotein involved in mucosal defence which is triggered by inflammation.43 Deeper analysis of B. vulgatus’s contribution in metabolism is now warranted. In the same MGS cluster, we also found GU:373 Coprococcus_sp.x5. Rodent data indicate that Coprococcus increases in fructose-fed animals, which develop metabolic syndrome. Coprococcus decreases in animals after either antibiotic treatment or faecal transfer, which improved their metabolic phenotype.44 In contrast, another MGS cluster was composed of species strongly reduced with increasing trunk-fat. This cluster includes Clostridiales (Lachnospiraceae and Ruminococcaceae), the genera Blautia, Faecalibacterium, which has anti-inflammatory properties,45 and other Firmicutes. This observation paves the way to understanding the potential interaction or imbalance between these MGS and adverse body composition and metabolism. More insight is needed into other MGS clusters with unknown annotation to further explore these bacterial taxa associated with metabolic deterioration.
We also highlighted metabolomic interactions with MGR and its MGS signatures. 3-Methoxyphenylacetic acid, positively associated with MGR and negatively with trunk-fat mass and with B. vulgatus, appeared influenced by polyphenols. 3-Methoxyphenylacetic acid production results from polyphenol and flavonoid fermentation.46 Whether this metabolite mediates beneficial health effects via gut microbiota processing of food components needs further evaluation. Histidine is an essential amino acid found in protein-enriched diets and serum histidine is decreased in obese individuals,47 concordant with our result where histidine decreased with obesity severity. It was associated with 16 MGR-related MGS contained genes encoding histidine production/degradation pathway. We found key enzymes changes in the histidine degradation pathway (KO1745, KO1712, KO1468, KO1479) that may lead to L-glutamate production, a precursor of gamma-Aminobutyric acid (GABA),12 which is linked to the downregulation of proinflammatory cytokines and inflammatory diseases.48 Glutarate was also negatively associated with MGR-related MGS and positively with HbA1C49 and could be an interesting target to further investigate for its potential link with low-grade inflammation maintenance and altered metabolism.
If previous studies demonstrated changes in gut microbiota composition post-BS, most were performed using less resolutive techniques (quantitative PCR, 16S rDNA sequencing) in refs 50–53 in small subject groups or at only one time point post-BS. Very few studies used whole metagenome sequencing10–12 54 combined with large-scale multiomic approaches in paired patients followed at several time points for 1 year, when the nadir of weight loss and metabolic improvement occurs, nor compared the effects of the different techniques.
Using WGS, we showed that low MGR and related functional alterations in severe obesity are only partially rescued 1 year post-BS, and these changes marginally involve metagenomic and functional signature alterations seen at baseline. MGR increased only progressively and became significant 1 year after both surgeries, concordant with previous reports: (1) 8 RYGB patients showing a non-significantly increased MGR at 1 year10; (2) increased MGR 3 months postsleeve in a cohort similar in size to ours, using shotgun sequencing12; and (3) increased richness 6 months post-RYGB using 16S-pyrosequencing.50 Noteworthy, metformin, which represents the first line of diabetes treatment23 and not a marker of T2D severity, was given at baseline to most of our patients with T2D (8/9). Despite metformin, those patients had increased MGR, thus suggesting that low MGR cannot be solely attributed to metformin.
A major finding of our work is that despite the significant MGR increase, most patients remained with low MGR 1 year post-BS and even more post-RYGB, although the bioclinical improvements are more important to those observed post-AGB. These results question the overall contribution of gut microbiota changes in explaining weight loss and metabolism improvement. We nevertheless found bacterial species associated with improved metabolic traits at 1 year. In addition, evidence of gut microbiota contribution originates from faeces transfer experiments. Transferring faeces from either RYGB-operated mice or humans into germ-free mice reproduced some clinical improvements.11 52 Nevertheless, the effects in terms of metabolic improvement or magnitude of weight loss were always much smaller after the faeces transfer than that observed by the surgery itself. Altogether, these elements probably suggest that whereas gut microbiota components may contribute to some aspects of metabolic improvements, many other mechanisms are involved. Notably, causal compositional modifications could relate to changes in hormonal secretion, bile acids availability53 or other mechanisms9 associated with metabolic improvements post-BS. Our study also shows that more than increased MGR, the switch of enterotypes post-RYGB could be an important feature in improved metabolic outcomes.
When looking at MGS profiles, AGB induced a few significant modifications, some of which are in the opposite direction to those seen post-RYGB. Compared with RYGB, AGB solely restricts food intake and induces weight loss with limited effects on digestive tract ecology or hormonal changes.8 Sleeve gastrectomy12 has been shown to significantly change gut microbiota. Post-RYGB, nine MGS significantly increased whereas two MGS decreased at M12, but they were not similar from those associated with clinical variables and MGR at baseline. This suggests a specific switch of the gut microbiota induced by the surgical change of digestive physiology.9 Among these MGS changing post-RYGB, H. hathewayi (a Clostridiales member of the phylum Firmicutes) was associated with improved trunk-fat mass and HbA1c. This species has not previously been linked to metabolic diseases, but is associated with sepsis, where it is increased in the blood.55 Alistipes shahii increased post-BS and was associated with metabolic improvements confirming previous data.50 Two species were significantly decreased post-RYGB, including A. hadrus, a butyrate-producing species. When adding a strain of this species into a colitis-induced rodent model, it exacerbated the disease severity with associated severe dysbiosis.56 Conversely, adding this strain in healthy mice demonstrated favourable outcomes. These observations illustrate that specific strains could be associated with adverse outcomes when present in a dysbiotic microbiota.
BS significantly modulated 30 metabolites, some of which were associated with MGS changes and clinical improvement. Glycine increased post-surgery concordant with previously observed increased glycine levels in the urine metabolome of obese patients post-BS.57 Compared with lean individuals, glycine decreases in obesity.58 We found that acetylglycine was associated with corpulence improvements and H. hathewayi, which was linked to Hba1c. Acetylglycine has been associated with a reduced risk of T2D development59; therefore, we could postulate that increased acetylglycine levels post-RYGB could be linked to improved health status and the reduction of T2D incidence/T2D remission post-BS.8 Finally, in these post-BS patients improving their insulin resistance, we observed a reduction in branched-chain amino acid, which is similar to the known relation between increased branched-chain amino acid (BCAA) and insulin resistance.39
We acknowledge that our study presents some limitations. We display numerous associations between changes in MGS, metabolites and clinical metabolic and corpulence phenotype that should be further tested in vitro or in germ-free mice models. However, the strengths of our study lays in the high-throughput analysis using multiomic data in well-phenotyped subjects followed at different kinetic time points post-BS. Furthermore, we had access to independent cohorts where we could replicate our findings. We also display that MGR increases at 1 year and then further stabilises in the longer term at 5 years. Another limitation was the absence of available food intake data. However, food reduction in terms of total calorie, lipid or carbohydrate intake is neither different between AGB and RYGB at 1 and 3 months post-BS,14 nor between sleeve and RYGB at 3 and 12 months.16 Therefore, we do not believe that the observed differences in MGR or microbiota characteristics before, but also 1 year post-BS, originate from diet differences between the two surgical groups.
To conclude, severe obesity is characterised by very low MGR. Furthermore, low MGR is characterised by a specific MGS signature that associates with clinical traits such as visceral adiposity, adipocyte hypertrophy, and metabolic and inflammatory consequences. We identified new metagenomic signatures, functional modifications and serum metabolites associated with decreased MGR, and demonstrate that the four enterotypes are also found in severe obesity. It remains unknown whether this low MGR is a cause or consequence of obesity and of its duration, but it represents a good biomarker of gut microbiota alteration, eventually useful for patient stratification. Lifestyle factors such as diet and corpulence explain a large part of microbiome composition variability as compared with host genetic,60 but this needs to be deciphered in severe obesity. After BS, enterotype modification was observed, but most patients remain with very low MGR, despite digestive tract modifications and clinical major improvements. Interventions, such as faecal transfer experiment, showed increased MGR and metabolic improvements in individuals with metabolic syndrome with low MGR at baseline.61 Thus, a perspective of this work would be to use strategies aiming at restoring gut microbiota ecosystem before or during the BS intervention and examine whether these interventions could further improve further MGR and/or clinical outcomes post-BS.
Acknowledgments
The authors wish to thank Ms Valentine Lemoine for patient recruitment and Dr Florence Marchelli, who contributed to clinical and biological data collections in patients and database constitution. The authors thank Professors Jean-Michel Oppert and Christine Poitou for contribution to patient recruitment and the paramedic staff from the Nutrition Department, Pitié-Salpêtrière Hospital. The investigation was performed at the Clinical Center of Human Nutrition (Paris-Ile de France). The authors thank Timothy Swartz for English-language review of the manuscript.
References
Footnotes
JA-W, EP and EB contributed equally.
Contributors JA-W and KC conceptualised the study. JA-W, EP and KC drafted the manuscript and have primary responsibility for the final content of the manuscript. EP, EB, JA-W, EOV, J-DZ, MCD and BDK analysed the data, conducted the statistical tests, and drafted the tables and figures. JLB and J-MC performed the bariatric surgeries. NP, ELC, FL, SDE and JD produced metagenomics data and determined the microbiome composition. FI and LH produced the metabolomics data. All authors read and approved the final manuscript.
Funding This project is supported by the ’Programme Hospitalier de Recherche Clinique' (PHRC Microbaria AOM10285/P100111 to KC). JA-W received a grant from Institut Appert, from Nestlé research and from Aviesan alliance nationale pour les sciences de la vie et de la santé ITMO santé publique. Partners have received funding from the European Union’s Seventh Framework Programme (FP7) for research, technological development and demonstration under grant agreement HEALTH-F4-2012-305312 (MetaCardis) and from the French ’Investissement d’Avenir' FORCE and the MetaGenoPolis grant ANR-11-DPBS-0001. Clinical investigation is performed at the Human Nutrition Research Center (CRNH Ile de France), Pitié-Salpêtrière Hospital.
Competing interests None declared.
Patient consent Not required.
Ethics approval Ethical approval was obtained from the Pitié-Salpêtrière Hospital Research Ethics Committee (CPP Ile-de-France).
Provenance and peer review Not commissioned; externally peer reviewed.
Correction notice This article has been corrected since it published Online First. Lyamine Hedjazi’s name has been corrected.