Article Text

Abstract
Background and aims Gastric intestinal metaplasia (IM) is common in the gastric epithelium of patients with chronic atrophic gastritis. CDX2 activation in IM is driven by reflux of bile acids and following chronic inflammation. But the mechanism underlying how bile acids activate CDX2 in gastric epithelium has not been fully explored.
Methods We performed microRNA (miRNA) and messenger RNA (mRNA) profiling using microarray in cells treated with bile acids. Data integration of the miRNA/mRNA profiles with gene ontology (GO) analysis and bioinformatics was performed to detect potential miRNA-mRNA regulatory circuits. Transfection of gastric cancer cell lines with miRNA mimics and inhibitors was used to evaluate their effects on the expression of candidate targets and functions. Immunohistochemistry and in situhybridisation were used to detect the expression of selected miRNAs and their targets in IM tissue microarrays.
Results We demonstrate a bile acids-triggered pathway involving upregulation of miR-92a-1–5p and suppression of its target FOXD1 in gastric cells. We first found that miR-92a-1–5p was increased in IM tissues and induced by bile acids. Moreover, miR-92a-1–5p was found to activate CDX2 and downstream intestinal markers by targeting FOXD1/FOXJ1 axis and modulating activation of nuclear factor kappa B (NF-κB) pathway. Furthermore, these effects were found to be clinical relevant, as high miR-92a-1–5p levels were correlated with low FOXD1 levels and high CDX2 levels in IM tissues.
Conclusion These findings suggest a miR-92a-1–5p/FOXD1/NF-κB/CDX2 regulatory axis plays key roles in the generation of IM phenotype from gastric cells. Suppression of miR-92a-1–5p and restoration of FOXD1 may be a preventive approach for gastric IM in patients with bile regurgitation.
- bile reflux
- gastric pre-cancer
- molecular mechanisms
- gastric inflammation
- gastric metaplasia
This is an open access article distributed in accordance with the Creative Commons Attribution Non Commercial (CC BY-NC 4.0) license, which permits others to distribute, remix, adapt, build upon this work non-commercially, and license their derivative works on different terms, provided the original work is properly cited, appropriate credit is given, any changes made indicated, and the use is non-commercial. See: http://creativecommons.org/licenses/by-nc/4.0/.
Statistics from Altmetric.com
Significance of this study
What is already known on this subject?
Gastric cancer is the second leading cause of cancer-related deaths worldwide.
Gastric intestinal metaplasia (IM) increases risk for cancer development.
Besides Helicobacter pylori infection, reflux of bile acids is an important pathogeny for gastric IM, whereas the mechanisms contributing to bile acids-inducing IM development are poorly understood.
CDX2 is an intestinal-specific transcription factor that directs and maintains intestinal differentiation in developing intestine, and in both gastric IM and Barrett’s metaplasia.
miR-17–92 members are overexpressed in many kinds of cancer including gastric cancer and upregulated in the serum of both gastric cancer and IM patients.
What are the new findings?
Different fractions of bile acids induced expression of CDX2 and intestinal markers in time-dependent and dose-dependent manner in gastric cells.
miR-92a-1–5p was identified in microRNA (miRNA) microarray and GO analysis, whose expression was found to be increased in bile acids-stimulated gastric cells and IM tissues.
miR-92a-1–5p promoted expression of CDX2 and downstream intestinal markers by directly targeting 3’-untranslated region of FOXD1, which was screened by integrating messenger RNA profiles and bioinformatic prediction.
miR-92a-1–5p/FOXD1/FOXJ1 axis positively regulated CDX2 expression through promoting phosphorylation and nuclear translocation of nuclear factor kappa B in gastric cells.
The miR-92a-1–5p/FOXD1/CDX2 pathway is characteristic of gastric normal and IM tissues.
Significance of this study
How might it impact on clinical practice in the foreseeable future?
Our study highlights bile acids-induced miRNA alterations in gastric cells that are potential early events in the cascade leading to development of IM and gastric cancer.
The identified miR-92a-1–5p/FOXD1/CDX2 pathway has the potential in developing new biomarkers and therapeutic targets for IM and gastric cancer.
Introduction
Gastric cancer, the second leading cause of cancer-related deaths worldwide,1 is one of the few human cancers where the single lesion preceding neoplastic transformation is an aberrant differentiation—intestinal metaplasia (IM)—rather than an adenomatous growth.2 As more and more epidemiological studies ascertained the increased risk for cancer development conferred by IM,3–5 it become of the utmost importance to study the mechanism underlying the arising of IM in stomach.
Gastric IM, the replacement of intestinal type cells in normal gastric epithelium, is considered to be driven by chronic environmental stimulation such as reflux of bile acids and Helicobacter pylori-associated inflammation.6 7 However, whether IM patients benefit from H. pylori eradication has not reached a general consensus. Some groups described a positive effect of H. pylori eradication on progression of IM,8 while others suggest the opposite results,9 indicating other factors besides H. pylori, such as bile reflux, may contribute to the progression of IM. Interestingly, Barrett’s metaplasia, another type of IM which occurs in oesophagus, is proved to be a result of chronic bile reflux in quite a few epidemiological studies,10 11 in vitro models12 13 and animal models.6 14
The molecular trigger for intestinal differentiation in the gastric context is the expression of CDX2, an intestinal-specific transcription factor (TF) that directs and maintains intestinal differentiation in developing intestine,15 16 and in both gastric IM and Barrett’s metaplasia.17 18 CDX2 mediates transdifferentiation in IM through promoting transcription of intestinal markers such as Krüppel-like factor4 (KLF4), VILLIN (VIL1), MUCIN 2 (MUC2), sucrase-isomaltase (S-I), etc.2 17 In the context of Barrett’s metaplasia, CDX2 expression could also be promoted by other intestinal-specific TFs such as KLF4 and CDX1, mostly through activation of nuclear factor kappa B (NF-κB) pathway in response to chronic bile reflux.12 19 However, how bile acids reflux break the homeostasis of gastric epithelium and the mechanism underlying the upregulation of CDX2 in gastric IM remains largely unknown.
MicroRNAs (miRNAs) are important small non-coding RNAs that either inhibit the translation of or trigger the degradation of target messenger RNAs (mRNAs) through binding to the 3′-untranslated regions (3’-UTRs).20 21 Recent studies identified several dysregulated miRNAs, which play key roles in gastric IM and gastric cancer.22 23 In particular, we previously showed that miR-296–5p is involved with the malignant transformation of gastric IM towards gastric cancer by targeting CDX1 and activating MAPK/EKR pathway,24 indicating potential miRNA-TF networks in gastric IM. More recently, we found that several miR-17–92 members overexpressed in many kinds of cancer,25–27 were upregulated in the serum of both gastric cancer and IM patients, suggesting that the miR-17–92 cluster may play important roles in the regulation of gastric IM.25 Recent studies also found that continuously high levels of onco-miRs including miR-17–92 members may be one of the reasons for the failure of IM-reversing therapy after helicobacter pylori (Hp) eradication.23 28 29
Herein, we identified that miR-92a-1–5p, a member of miR-17–92 cluster, was dramatically upregulated in gastric cells on bile acids treatment and induced a intestine-like phenotype. Based on these results and the recent findings suggesting role of miR-17–92 clusters in gastric IM and cancer, we hypothesised that miR-92a-1–5p may mediate the molecular changes caused by chronic bile reflux in gastric epithelium and promotes subsequent progression of IM.
Methods
Cell lines
GES-1 is a SV40 transformed human fetal gastric epithelial cell line, which were established in 1994 and proved to maintain a normal cytoskeleton, positive in PAS reaction and were non-tumourigenic in nude mice.30 GES-1, SGC7901, MKN28, MKN45 and AGS cells (originally purchased from ATCC) were maintained in RPMI-1640 medium; BGC823 and HEK293T cells (originally purchased from ATCC) were cultured in Dulbecco’s modified Eagle’s medium (Thermo Scientific HyClone, Beijing, China).
Tissue microarray
An IM tissue microarray containing 72 cases of IM and paired adjacent normal tissue was purchased from Alenabio Biotech (ST8017a, BN01013a). All the samples were shown to be correctly labelled clinically and pathologically.
MicroRNA microarray
Cells were incubated with DCA for 24 hours after a 24-hour starvation. Then the media were changed back to normal one and RNA were extracted 48 hours later. miRNA microarray analysis was performed with a total of 1347 represented miRNAs (Agilent Technologies, Palo Alto, California, USA) following the manufacturer’s instruction.
In situ hybridisation and immunohistochemistry
In situ hybridisation (ISH) and immunohistochemistry (IHC) were performed as previously described using FOXD1 antibody (Cell Signaling Technology), CDX2 (Cell Signaling Technology), p-p65 (Abcam) and a 5’-digoxigenin (DIG) and 3’-DIG-labelled locked nucleic acid-based probe specific for miR-92a-1–5p (Exiqon) on tissue microarray chips (Shanghai Outdo Biotechnology).31 The results of IHC and ISH were independently scored by two independent observers. The intensity of staining was divided into four grades (intensity scores): negative (0), weak (1), moderate (2) and strong (3) (online supplemental figure S1).
Supplementary file 2
Constructs and lentivirus infection
Expression vectors encoding FOXD1 and FOXJ1 were constructed by cloning the open reading frames and downstream 3’-UTR into the pcDNA 3.1 vector (Invitrogen) between HindIII and EcoRI sites for expression driven by the CMV promoter. The 3’-UTR fragments of FOXD1 containing miR-92a-1–5p target sites were amplified and cloned as described.24 32 The short hairpin RNA sequences of FOXD1 were amplified and cloned into the GV115 vector (GeneChem) between AgeI and EcorI sites for expression driven by the CMV promoter as described before.31
Oligonucleotide transfection
Synthetic miR-92a-1–5p mimic, inhibitor and their negative control oligonucleotides were purchased from RiBoBio (Guangzhou, China) and GenePharm (Shanghai, China). Target cells were transfected with miR-92a-1–5p mimics or inhibitor and correlated negative control using DharmaFect Transfection reagent (Thermo Fisher Scientific) according to the manufacturer’s protocol.
Luciferase reporter assays
Cells were transfected with appropriate plasmids in 24-well plates. Cells were harvested and lysed for luciferase assays 48 hours after transfection. Luciferase assays were performed using a Dual-Luciferase Reporter Assay System (Promega, Wisconsin, USA) according to the manufacturer’s protocol. Firefly luciferase activity normalised to Renilla luciferase was used as an internal control. The transfection experiments were performed in triplicate for each plasmid construct.
EZ-TFA assay
To detect the activity of p65, an NF-κB family EZ-TFA TFAssay Chemiluminescent Kit (Millipore, Schwalbach, Germany) was used according to the manufacturer’s protocol.
Ch-IP assay
Ch-IP assays were performed using the Magna Ch-IP G Assay kit (EMD Millipore). Cells were cross-linked with 1% formaldehyde for 10 min at room temperature and quenched in glycine. DNA was immunoprecipitated from the sonicated cell lysates using p65/Foxd1 antibody (Abcam) and subjected to PCR to amplify the p65/Foxd1 binding sites.
Statistical analysis
SPSS software (V.19.0, SPSS, Chicago, Illinois, USA) was used for statistical analyses. Continuous data were presented as mean±SEM and were compared between two groups by Student’s unpaired t-test. Frequencies of categorical variables were compared using the χ2 test. Spearman’s rank correlation coefficients were computed for assessing mutual association among clinical results. P<0.05 was considered to be statistically significant (*p<0.05, **p<0.01).
See online supplemental materials and methods for more details.
Supplementary file 1
Results
Bile acids induced CDX2 and intestinal markers in gastric cells
To examine the significance of bile acids in gastric IM, we first treat GES-1 cells, an immortalised GES, with four kinds of bile acids at different doses for different time (figure 1A). The determination of the time points was based on the results showing the time of peak levels of CDX2 after replacing with normal medium for GES-1 cells (online supplemental figure S2). The mRNA expression of several intestinal markers were examined by RT-PCR after bile acids treatment. The results showed that expression of KLF4, MUC2 and VIL1 were significantly increased by stimulation of cholic acid (CA), deoxycholic acid (DCA), chenodeoxycholic acid (CDCA) and dehydrocholic acid (DHCA) in a time-dependent and dose-dependent manner (figure 1B, C). CDCA was chosen in the following experiments as the most powerful stimuli among all the bile acids to induce the expression of intestinal markers. CDX2 expression were also found to be dramatically increased after CDCA treatment on levels of mRNA and protein (figure 1D, E), close to levels in intestinal positive control cells HT-29. Immunofluorescence results further showed that CDCA induced expression of MUC2 and VIL1 on the membrane of GES-1 cells (figure 1F, supplemental figure S3), similar as positive control Caco-2 cells. Together, these results suggest that bile acids, especially CDCA, induced an increase of CDX2 and downstream intestine-specific markers in GES-1 cells. miR-92a-1–5p was increased in bile acids-stimulated gastric cells and IM tissues.

Bile acids induced CDX2 and intestinal markers in gastric cells. (A) Workflow to examine the change of phenotype in gastric epithelial cell line (GES)-1 cells treated with bile acids. Fractions of bile acids: CA, DCA, CDCA and DHCA. Incubating time: 3, 6, 9, 12 and 24 hours at 50 µM; dosage: 50, 62.5, 75, 87.5 and 100 µM for 24 hours. (B) Expression of Krüppel-like factor 4 (KLF4), VILLIN (VIL1), MUCIN 2 (MUC2) were increased on stimulation of bile acids in a time-dependent manner. Incubating time: 3, 6, 9, 12 and 24 hours; dosage: 50 µM. (C) Expression of KLF4, MUC2 and VIL1 were increased on stimulation of bile acids in a dose-dependent manner. Incubating time: 24 hours; dosage: 50, 62.5, 75, 87.5 and 100 µM. (D) Top: messenger RNA (mRNA) levels of CDX2 was increased by CDCA treatment in a time-dependent manner. Incubating time: 3, 6, 9, 12 and 24 hours. Dosage: 50 µM. Bottom: mRNA levels of CDX2 was increased by CDCA treatment in a dose-dependent manner. Incubating time: 24 hours; dosage: 50, 62.5, 75, 87.5 and 100 µM. GAPDH RNA was used as internal control in qRT-PCR. (E) Protein levels of CDX2 in GES-1 cells treated with CDCA (100 µM) for 24 hours. HT-29 as a positive control. β-Actin levels were used as internal control. (F) MUC2 expression in GES-1 cells treated with CDCA (100 µM) for 24 hours. Caco-2 as a positive control. Means±SEM of a representative experiment (n=3) performed in triplicates are shown. *P<0.05; **p<0.01. N.S., not significant.
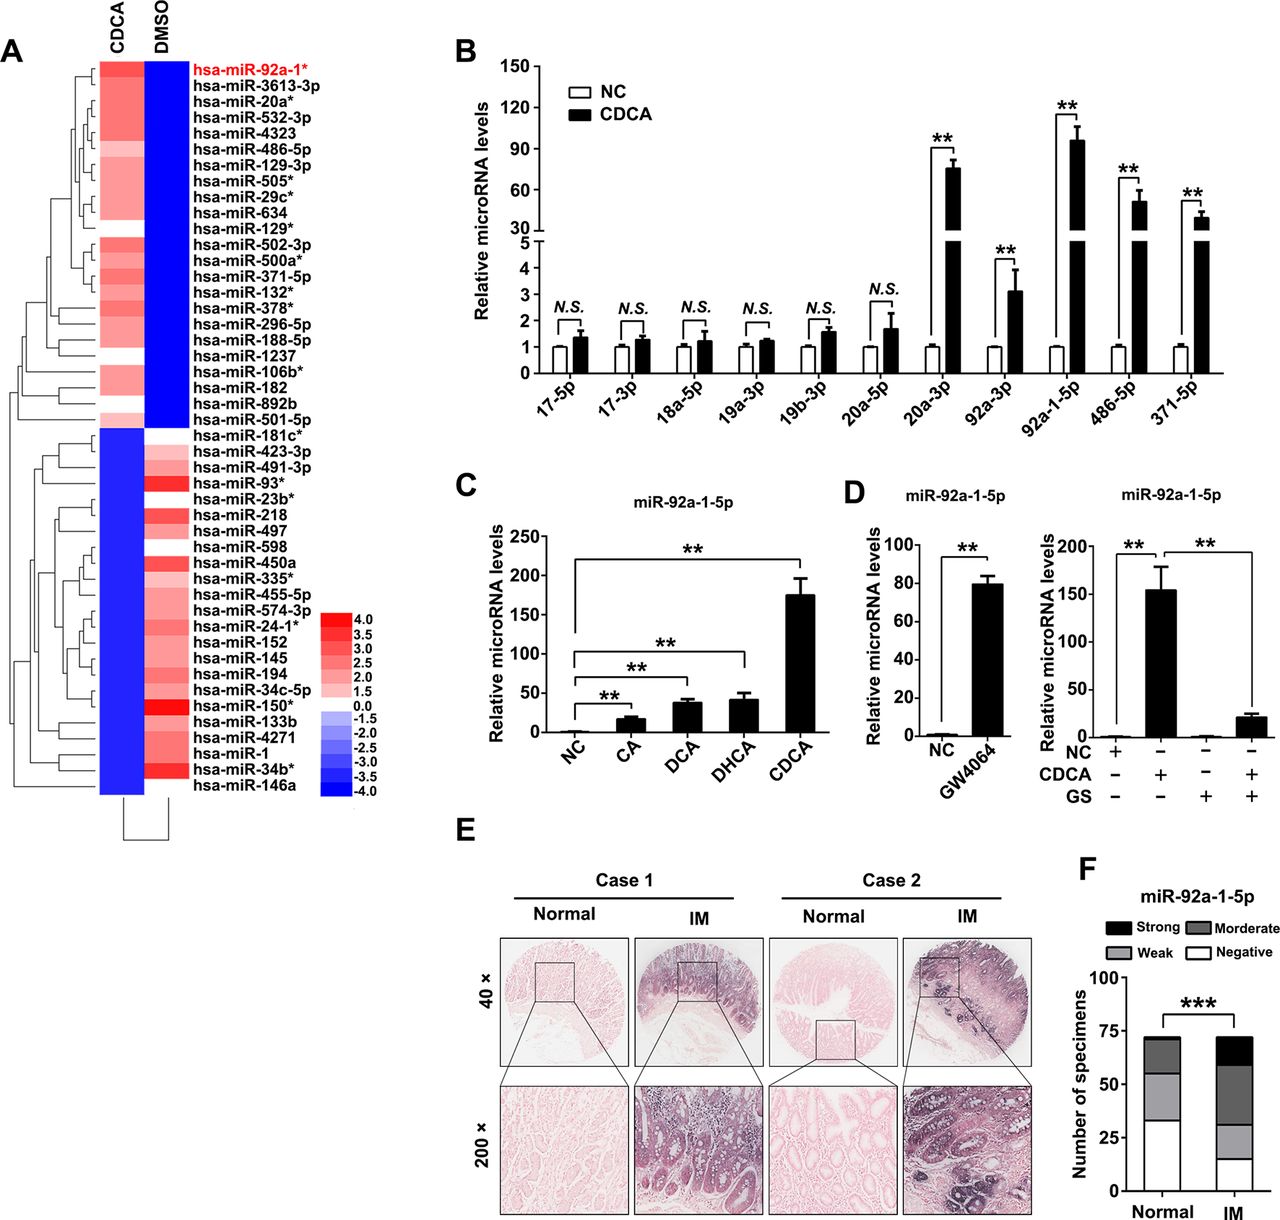
To investigate the mechanism of CDX2 upregulation after bile acids treatment, an miRNA microarray were performed and 46 miRNAs were upregulated in GES-1 cells after CDCA treatment (figure 2A, online supplemental table S2). Members of miR-17–92 cluster miRNAs have been proved to play key roles in gastric cancer and IM.27 Thus, we examined expression of several miRNAs of miR-17–92 family and other potentially functional miRNAs.33 The qRT-PCR results showed that miR-20a-3p, miR-92a-3p, miR-92a-1–5p, miR-486–5p and miR-371–5p were increased by CDCA (figure 2B). We also found that miR-92a-1–5p was induced by other kinds of bile acids in gastric cells (figure 2C). Interestingly, miR-92a-1–5p were further found to be increased by GW4064, the agonist of farnesoid X receptor (FXR), which is the natural receptor of CDCA (figure 2D, left). Additionally, the increase of miR-92a-1–5p induced by CDCA were found to be abolished by FXR antagonist Guggulsterone (GS) (figure 2D, right). Moreover, we measured miR-92a-1–5p expression in a cohort of 72 gastric IM using ISH. miR-92a-1–5p was significantly upregulated in IM tissues compared with adjacent normal gastric tissues (figure 2E, F, online supplemental table S3). Collectively, these results suggest that bile acids increases miR-92a-1–5p expression, which is upregulated in gastric IM tissues. miR-92a-1–5p increases CDX2 expression and downstream intestinal markers.
Supplementary file 3

miR-92a-1–5p was increased in bile acids-stimulated gastric cells and intestinal metaplasia (IM). (A) Heatmap of differential microRNA (miRNA) expression between negative control (NC) and CDCA-treated gastric epithelial cell line (GES)-1 cells. Gene expression data were obtained using a human miRNA array. Expression values shown are mean centred. Red: increased expression, blue: decreased expression. Incubating time: 24 hours; dosage: 100 µM. RNA was extracted as in figure 1A. (B) Expression of miR-17–92 cluster members, miR-486–5p and miR-371–5p were determined by qRT-PCR in CDCA-treated GES-1 cells. U6 RNA was used as internal control. (C) qRT-PCR results showed miR-92a-5p expression was increased in GES-1 cells treated with different fractions of bile acids. Incubating time: 24 hours; dosage: 100 µM. U6 RNA was used as internal control. (D) Left: miR-92a-1–5p was increased by farnesoid X receptor (FXR) agonist GW4064. Right: upregulation of miR-92a-1–5p by CDCA was rescued by FXR antagonist Guggulsterone (GS). U6 RNA was used as internal control. (E–F) Representative images (E) and analysis (F) of in situ hybridisation (ISH) staining for miR-92a-1–5p in 72 normal and paired IM tissues. N.S., not significant. ** p < 0.01 ; *** p < 0.001.
To investigate miR-92a-1–5p function in regard to gastric IM, GES-1 and AGS cells were chosen in following gain-of-function and loss-of-function experiment, respectively, while BGC823 was used in both sets of experiments, according to the quantification of miR-92a-1–5p and CDX2 expression (online supplemental figure S4A-C). Cells were transfected with miR-92a-1–5p mimics and inhibitors or negative control, and miR-92a-1–5p expression was confirmed by qRT-PCR (figure 3A). Further results showed that CDX2 mRNA expression were significantly increased by miR-92a-1–5p restoration, whereas knockdown of miR-92a-1–5p decreased CDX2 expression (figure 3B). Similar to this result, we also showed that miR-92a-1–5p positively regulated expression of KLF4, MUC2 and VIL1 (online supplemental figure S5A-F), which are all downstream intestinal markers of CDX2. Similarly, western blot analysis results also showed that expression of CDX2 and downstream intestinal markers including S-I and KLF4 were induced by miR-92a-1–5p upregulation (online supplemental figure S5G-H). More interestingly, we found that knockdown of miR-92a-5p abrogated the CDX2 upregulation induced by either CDCA or FXR agonist GW4064 (figure 3C). Together, these results suggest that bile acids induced CDX2 expression and downstream intestinal markers at least partially through miR-92a-1–5p. miR-92a-mRNA regulatory networks in bile acids-treated gastric cells.

miR-92a-1–5p increases expression of CDX2 and intestinal markers and miR-92a-mRNA regulatory networks. (A) Gastric epithelial cell line (GES)-1 and BGC823 cells were transfected with miR-92a-1–5p mimics or inhibitors at a final concentration of 100 and 200 nM. miR-92a-1–5p expression was detected by qRT-PCR at 48 hours post-transfection. U6 was used as an internal control in qRT-PCR of miR-92a-1–5p. (B) GES-1, BGC823 and AGS cells were transfected as in figure 3A and CDX2 expression was examined by qRT-PCR. (C) GES-1 cells was treated with CDCA (top) or GW4064 (bottom) together with inhibitor of miR-92a-1–5p and CDX2 expression was determined by qRT-PCR. GAPDH RNA was used as internal control in qRT-PCR of CDX2. (D) Whole genome expression profiles for GES-1 cells treated with CDCA (100 µM) for 24 hours. Heat map (left) and Volcano plot (right) illustrating the global differences in gene expression between CDCA-treated GES-1 cells and control (fold change >2.0; p<0.05). (E) Bioinformatic analysis of microRNA (miRNA)-targets regulation through integrating miRNA microarray results and whole genome expression profiles results. Red square: increased miRNAs in CDCA-treated GES-1 cells. Blue circles: decreased genes in CDCA-treated GES-1 cells. (F) GO analysis of increased miRNAs in CDCA-treated GES-1 cells focusing on miR-92a-1–5p function. Means±SEM of a representative experiment (n=3) performed in triplicates are shown. *P<0.05; **p<0.01.
To further identify the functional targets of miR-92a-1–5p, we performed an mRNA profile on CDCA-treated GES-1 cells. In this profile, 977 genes (fold change >2) were found to be decreased in CDCA-stimulated cells compared with control cells (figure 3D). Several of these mRNAs were testified by qRT-PCR (online supplemental figure S6). Through integrating these decreased genes with upregulated miRNAs in miRNA profile (figure 2A), together with three independent miRNA-targets databases previously used,24 31 we generated a miRNA-mRNA regulatory networks in bile acids-treated gastric cells (figure 3E), focusing on potential function of miR-92a-1–5p in targeting FOXD1, JAK3, Foxa1, etc. Further GO analysis showed important roles of miR-92a-1–5p in multiple functions such as transforming growth factor-β signalling pathway, cell growth regulation and epithelial cell differentiation (figure 3F), all of which are vital pathways in both transdifferentiation towards IM and malignant transformation for gastric epithelial cells. Together, these results suggest a pivotal role of miR-92a-1–5p in mediating the molecular changes of gastric cells in response to bile acids. miR-92a-1–5p downregulates FOXD1 expression by directly binding its 3′-UTR.
To further investigate the mechanism of miR-92a-1–5p in gastric IM, computational predicted targets were overlapped with decreased genes in mRNA profile and 114 overlapped targets were identified (figure 4A, supplemental table S4). Among them, FOXD1 were noticed as proved to be a negative regulator of NF-κB pathway,34 which was reported to promote transcription of CDX2 in oesophagus cells.17 35 We further found that CDCA treatment led to a dramatic decrease of FOXD1 in GES-1 cells, which effects was abrogated by miR-92a-1–5p inhibitors (figure 4B). To determine whether miR-92a-1–5p repressed FOXD1 by targeting the potential binding site, PCR products containing either the wild-type or mutant FOXD1-3’-UTR sequences were cloned downstream of a luciferase open reading frame (figure 4C). The overexpression of miR-92a-1–5p suppressed the luciferase activities of the FOXD1 3’-UTR reporter constructs, whereas the effect was abolished when mutations were introduced into its seed sequences (figure 4D). Furthermore, western blot analysis and PCR analysis revealed that ectopic miR-92a-1–5p expression reduced the protein and mRNA levels of FOXD1, while miR-92a-1–5p knockdown increased FOXD1 expression (figure 4E, F). Together, these results suggest that miR-92a-1–5p reduced FOXD1 expression by directly targeting the FOXD1 3’-UTR.

miR-92a-1–5p downregulates FOXD1 expression by directly binding its 3′-untranslated region (3′-UTR). (A) Predicted potential targets of miR-92a-1–5p using three independent microRNA (miRNA)-target databases were overlapped with decreased messenger RNA (mRNAs) in mRNA profile. (B) FOXD1 and CDX2 protein levels was examined by western blot analysis in gastric epithelial cell line (GES)-1 cells treated with CDCA together with miR-92a-1–5p inhibitor or control. (C) A schematic representation of the FOXD1 3’-UTR. Mutations were generated at the predicted miR-92a-1–5p-binding sites. (D) The wild-type or mutant reporter plasmids were co-transfected with miR-92a-1–5p or NC in HEK293T, GES-1 and BGC823 cells. (E) FOXD1 expression were determined by western blot analysis in GES-1 cells transfected with miR-92a-1–5p mimics and AGS cells transfected with miR-92a-1–5p inhibitors 72 hours post-transfection (final concentration: 200 and 300 nM). β-Actin levels were used as internal control in immunoblots. (F) The levels of FOXD1 mRNA was analysed by qRT-PCR at 48 hours post-transfection in GES-1 and AGS cells as transfected in figure 3A,B. GAPDH levels was used as internal control. Means±SEM of a representative experiment (n=3) performed in triplicates are shown. *P<0.05; **p<0.01. N.S., not significant.
miR-92a-1–5p regulates CDX2 expression through a FOXD1-NF-κB pathway
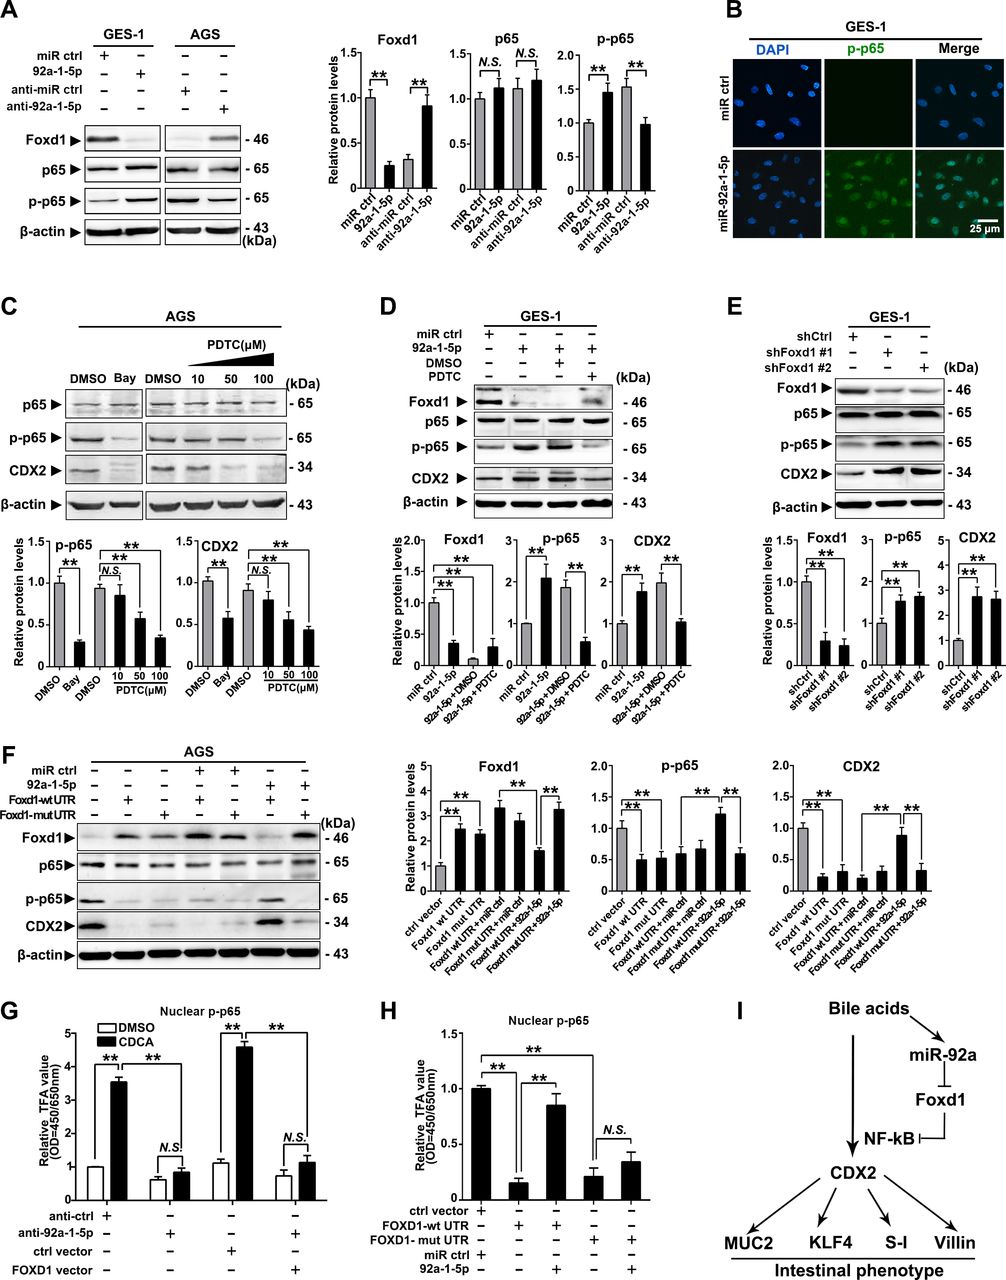
To further investigate the mechanism underlying the gastric IM regulation by the miR-92a-1–5p/FOXD1 axis, we examined the phosphorylation of RelA (NF-κB, p65), which were found to mediate the activation of CDX2 on bile acids stimulation.17 35 Restoration of miR-92a-1–5p were found to induce phosphorylation of p65, while silencing miR-92a-1–5p elicited an decrease in p65 phosphorylation (figure 5A). Immunofluorescence also suggest that miR-92-1-5p promoted expression of nuclear phosphorylated-p65 in GES-1 cells (figure 5B). We then treat gastric cells with NF-κB inhibitors (Bay and PDTC) and found that inhibition of p65 phosphorylation decrease the expression of CDX2 induced by miR-92a-1–5p in AGS and GES-1 cells (figure 5C, D). On the other hand, knockdown of FOXD1 using siRNAs increased CDX2 expression and p65 phosphorylation in GES-1 cells (figure 5E).

miR-92a-1–5p regulates CDX2 expression through a FOXD1-nuclear factor kappa B (NF-κB) pathway. (A) Left: the levels of FOXD1, p65 and phosphor-p65 (p-p65) were analysed by western blot analysis in gastric epithelial cell line (GES)-1 and AGS cells with transfection of miR-92a-1–5p mimics and inhibitors, respectively. Right: quantification of western blot analysis results were normalised as to β-actin (p-p65 quantification was normalised as to p65). (B) Immunofluorescence showed p-p65 expression in the nuclei of GES-1 cells with upregulation of miR-92a-1–5p. (C) Top: western blot analysis showed expression of CDX2 was decreased by inhibition of p65 phosphorylation on Bay (1 µM, 1 hour) or PDTC (10–100 µM, 1 hour) treatment. Bottom: quantification of western blot analysis results normalised as in figure 6A. (D) Top: western blot analysis showed expression of CDX2 in GES-1 cells with restoration of miR-92a-1–5p together with pyrrolidinedithiocarbamic acid (PDTC) or dimethyl sulphoxide (DMSO). Bottom: quantification of western blot analysis results normalised as in figure 5A. (E) Top: western blot analysis showed knockdown of FOXD1 by short hairpin RNA (shRNA) led to increase of phosphorylation of p65 and consequential upregulation of CDX2. Bottom: quantification of western blot analysis results normalised as in figure 5A. (F) Left: AGS cells were infected with FOXD1-expressing vectors, along with miR-92a-1–5p. FOXD1, p65, p-p65 and CDX2 expression were detected by immunoblot. Right: quantification of western blot analysis results normalised as in figure 5A. β-Actin levels were used as internal control in all immunoblotting assays. (G) GES-1 cells were infected with FOXD1-expressing vectors, along with miR-92a-1–5p and treated with CDCA for 24 hours at 100 µM. Nuclear protein were extracted and p-p65 were examined by EZ-TFA assay. (H) AGS cells were treated as in figure 5F and p-p65 were examined by EZ-TFA assay. Means±SEM of a representative experiment (n=3) performed in triplicates are shown. *P<0.05; **p<0.01. (I) The schematic model demonstrating the sequential regulation of miR-92a, FOXD1, NF-κB and CDX2 in gastric cells on bile acids stimulation. N.S., not significant.
Western blot analysis further revealed that FOXD1 expression was significantly reduced in BGC823 cells co-transfected with miR-92a-1–5p and the lenti-FOXD1-wt-UTR, but no difference was observed in cells transfected with miR-92a-1–5p and the mut-UTR vector (supplemental figure S7A,B). Moreover, miR-92a-1–5p restoration abrogated the FOXD1-wt-UTR-induced inhibition of p65 phosphorylation as well as the expression of CDX2 (figure 5F). Additionally, we found that CDCA treatment increased the activity of p65, which was repressed by downregulation of miR-92a-1–5p and restoration of FOXD1 (figure 5G). Interestingly, miR-92a-1–5p restoration abrogated the FOXD1-wt-UTR-induced suppression of p65 activity, whereas not found in cells co-infected with miR-92a-1–5p and FOXD1-mut-UTR vectors (figure 5H). Together, these results suggest a bile acids-activation pathway involving upregulating of miR-92a-1–5p and suppression of FOXD1, resulting in activation of NF-κB and CDX2 and generation of intestinal phenotype (figure 5I).
FOXD1/FOXJ1 axis suppresses NF-κB pathway and CDX2 expression
We further elucidated the connection between FOXD1 and NF-κB pathway. Knockdown of FOXD1 led to decrease of protein and mRNA levels of IκBβ and FOXJ1, a reported negative regulator of NF-κB pathway through IκBβ,36 while expression of IKKs and other IκBs were not affected (online supplemental figure S8A,B). Besides, restoration of FOXD1 partially abrogated LPS-induced decrease of IκBβ and activation of p65 (online supplemental figure S8C). More importantly, NF-κB-luciferase reporter assays showed that silencing either FOXJ1 or FOXD1 induced increase of NF-κB activity and most NF-κB target genes, which were significantly attenuated by restoration of FOXJ1 (figure 6A, B). Then, the potential binding sites of FOXD1 on FOXJ1 promoter were predicted (online supplemental table S5) and verified by reporter gene assays (online supplemental figure S9A,B). Ch-IP assays further confirmed that FOXD1 directly binds to the two regions on the promoter of FOXJ1 in GES-1 cells (−1189 to −1182 bp and −489 to −479 bp) (online supplemental figure S9C,D). Moreover, we observed that upregulation of FOXJ1 dramatically decreased the percentage of GES-1 cells with nuclear translocation of p65 on stimulation of TNF-α (online supplemental figure S10A,B). These results suggest that FOXD1 suppresses NF-κB pathway through FOXJ1 and nuclear translocation of p65. We further found that phosphorylation of p65 and expression of CDX2 were increased and positively correlated in gastric IM tissues (figure 6C, online supplemental table S6 and S7). Reporter genes containing the CDX2 promoter were then transfected into GES-1 and AGS cells (online supplemental table S8 and figure 11A), and then, the cells were treated with CDCA. This analysis revealed that CDCA-based CDX2 regulation was controlled by potential NF-κB binding sites located between −2000 and −478 bp (figure 6D and online supplemental figure S11B). Ch-IP assays further confirmed that p65 binds to the two regions (−1029 to −1019 bp and −489 to −479 bp) (figure 6E, F; online supplemental figure S11C,D). These results revealed that NF-κB pathway, suppressed by FOXD1/FOXJ1 axis, promotes CDX2 expression by binding to its promoter in gastric cells stimulated by CDCA.
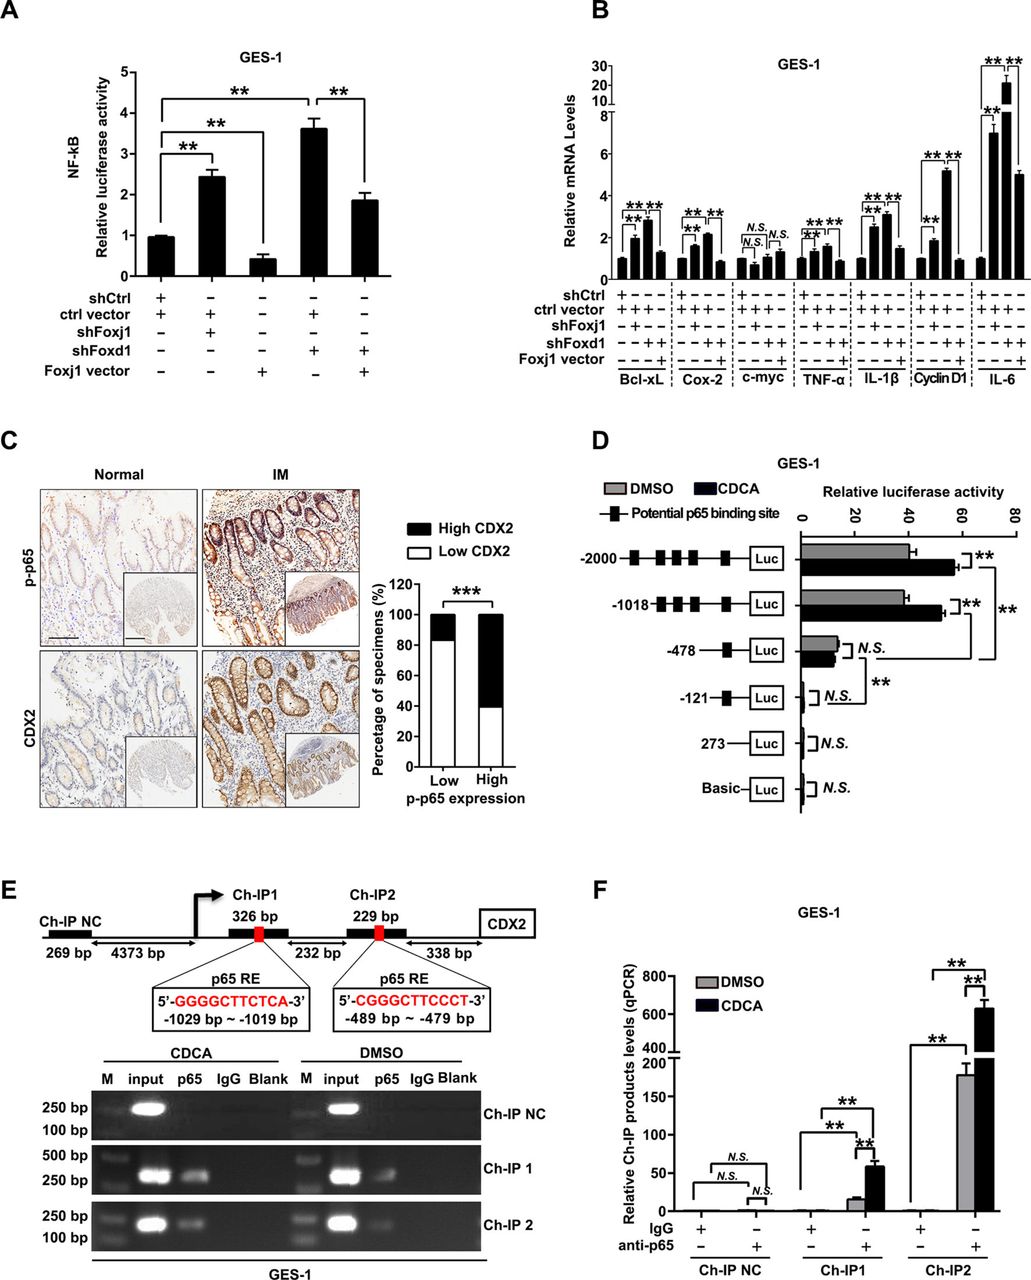
FOXD1/FOXJ1 axis inhibits nuclear factor kappa B (NF-κB) pathway and CDX2 transcription. (A) Gastric epithelial cell line (GES)-1 cells infected with FOXJ1 or FOXD1 short hairpin RNA (shRNA) were transfected with a pGL4.32 vector containing NF-κB-luciferase reporter along with FOXJ1-expressing vectors. NF-κB-luciferase activity was then measured by using GloMax plate reader. (B) GES-1 cells were infected with FOXJ1 or FOXD1 shRNA, followed by transfection of FOXJ1-expressing vectors or control and expression of NF-κB-pathway-regulated genes were examined by qRT-PCR. GAPDH RNA was used as internal control. (C) Left: the representative images of IHC staining for p-p65 and CDX2 in normal tissues and intestinal metaplasia (IM) tissues. Scale bars: 100 µm; 500 µm (insets). Right: association between expression of p-p65 and CDX2 levels in IM specimens. (D) Serially truncated CDX2 promoter constructs were cloned to pGL3-luciferase reporter plasmids and transfected into GES-1 cells. Four hours after transfection, cells were treated with CDCA (100 µM) for 24 hours and the relative luciferase activities were determined 72 hours after ending of CDCA treatment. (E) A Ch-IP assay demonstrated the direct binding of p65 to the CDX2 promoter in GES-1 cells. M: Marker. (F) qRT-PCR of the Ch-IP products validated the binding capacity of p65 to the CDX2 promoter. Means±SEM of a representative experiment (n=3) performed in triplicates are shown. *P<0.05; **p<0.01; ***p<0.001. N.S., not significant.
miR-92a-1–5p/FOXD1/CDX2 pathway is characteristic of IM tissues
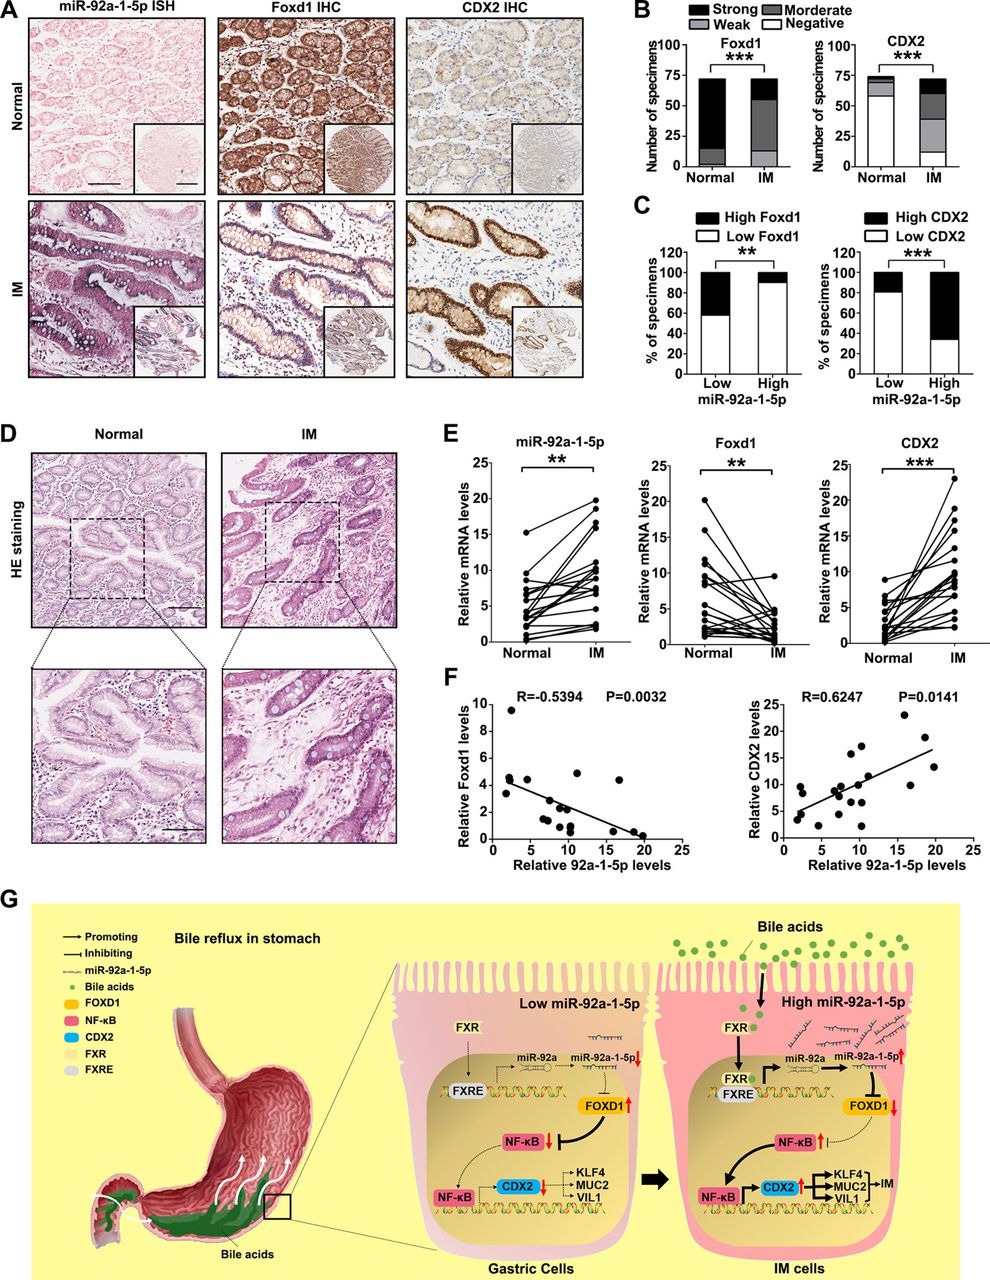
Finally, to test whether the regulation described above in GC cell lines is clinically relevant, IHC for FOXD1 and CDX2 was performed on the 72 gastric IM tissue cohort that was used for the miR-92a-1–5p analysis. Compared with normal tissues, the miR-92a-1–5p levels were increased in IM tissues (figure 7A). On the other hand, the levels of FOXD1 were decreased in IM tissues compared with that in normal tissues (figure 7B left, online supplemental table S9), while CDX2 levels were significantly increased in IM tissues (figure 7B, right, online supplemental table S7). The 72 IM patient cases were then divided into groups with relatively high or low levels of miR-92a-1–5p. From this analysis, we observed an inverse pattern for the expression of miR-92a-1–5p and FOXD1 (figure 7C, left). On the contrary, CDX2 expression was positively correlated with miR-92a-1–5p expression (figure 7C, right). Moreover, similar results were also observed for the 20 pairs of human normal and IM tissues (figure 7D-F). In summary, these results showed that the miR-92a-1–5p/FOXD1/CDX2 pathway is active in human gastric IM.

The miR-92a-1–5p/FOXD1/CDX2 pathway is characteristic of intestinal metaplasia (IM) tissues. (A) The representative images of in situ hybridisation (ISH) staining for miR-92a-1–5p and immunohistochemistry (IHC) staining for FOXD1 and CDX2 in normal tissues with low expression of miR-92a-1–5p and IM tissues with high expression of miR-92-1-5p. Scale bars: 100 µm; 500 µm (insets). (B) Analysis of IHC staining for FOXD1 (left) or CDX2 (right) in 72 normal and paired IM tissues. (C) Association between miR-92a-1–5p expression and FOXD1 (left) and CDX2 (right) levels in IM specimens. (D) The representative images of H&E staining of 20 paired normal and IM tissues. Scale bars: 100 µm (top); 50 µm (bottom). (E) qRT-PCR results of expression of miR-92a-1–5p, FOXD1 and CDX2 in 20 paired normal and IM tissues. (F) Negative correlation between levels of miR-92a-1–5p and that of FOXD1 and positive correlation between levels of miR-92a-1–5p and CDX2 in IM tissues. (G) A schematic model of miR-92a-1–5p/FOXD1/CDX2 pathway in gastric cells. In response to reflux of bile acids, FXR activation promotes the transcription of miR-92a, which suppresses the expression of FOXD1 and abrogates its inhibition on nuclear factor kappa B (NF-κB) pathway. Activation of p65 increases the transcription of CDX2, resulting in the upregulation of intestinal markers including Krüppel-like factor4 (KLF4), VILLIN (VIL1), MUCIN 2 (MUC2). ** p < 0.01 ; *** p < 0.001.
Discussion
In this study, we identified a bile acids-triggered pathway involving the upregulation of miR-92a-5p and its downstream target FOXD1; this pathway mediated the inducement of CDX2 by bile acids in intestinal metaplasia and may connect IM with gastric cancer.
The mechanism of transformation to intestinal metaplasia in gastric epithelium has not been clarified. The fundamental importance of CDX2 in regulating intestinal differentiation is now widely accepted. However, the molecular mechanisms driving de novo CDX2 expression in the stomach and oesophagus remain largely elusive. Here in, we found that bile acids induced CDX2 and its downstream intestinal markers in gastric cells. Similar to results of several recent studies focusing on intestinal metaplasia of Barrett’s oesophagus,17 37 our study provided evidences that fractions of bile acids induce a intestine-like phenotype in gastric cell lines. GES-1, the SV40 transformed human fetal GES, was proved to be non-tumourigenic in nude mice. It is considered as a non-malignant cell lines here to mimic the gastric epithelial cells suffering from reflux of bile acids. But other model systems using primary human gastric cells will be needed in future studies.
Members of miR-17–92 clusters were previously found to be overexpressed in many kinds of cancer.25–27 Interestingly, we previously reported that miR-17–92 members were overexpressed in the serum of both gastric cancer and intestinal metaplasia patients, suggesting that the miR-17–92 cluster might be useful as a potential serum biomarker for the early detection of gastric cancer.25 Here in, we identified a miRNA profile in gastric cells treated by bile acids in a miRNA microarray, in which upregulation of several members of miR-17–92 clusters were noticed. We found that miR-92a-1–5p, on top of the list of upregulated miRNAs, was induced by bile acids, which inducement were abolished by FXR antagonist GS, indicating the bile acids receptor FXR mediated the upregulation of miR-92a-1–5p in gastric cells. Dysregulation of miR-17–92 members was previously proved to be associated with IM and carcinogenesis of stomach.28 38 Recent studies also indicated that continuously high levels of onco-miRs including miR-17–92 members may partially contribute to the failure of IM-reversing therapy after Hp eradication.23 28 29 Together with our results here, these findings provided evidences that miR-17–92 family members may play important roles in promoting the progression of IM in stomach suffering from bile reflux.
The effects of bile acids are thought to be mainly mediated through the nuclear receptor FXR, both a natural intracellular receptor for bile acids and a TF with multiple functions.39 It is reported that FXR is necessary for bile acid-mediated overexpression of miR-221/222 in oesophagus cells40 and transcription of miR-122,41 suggesting that bile acids may regulate expression of miRNAs through miRNAs transcription promoted by FXR. In terms of miR-17–92 regulation, another possibility is that bile acids may regulate miR-17–92 cluster through c-myc, which promotes miR-17–92 transcription and was found to be increased in an FXR-independent manner by bile acids feeding.42 It will be explored in future studies to determine the pathways involved in the regulation of miRNAs, especially miR-92a modulated by bile acids. More interestingly, approximately 40% of IM tissues showed miR-92a-1–5p silence or downregulation here in this study. This may be due to the facts that only part of the gastric IM tissues were positive for c-myc, a miR-17–92 driver.43–45 Nevertheless, further studies will be needed to elucidate mechanism underlying the regulation of miR-92a in gastric IM. miRNAs function through regulation of its targets. We then bioinformatically identified FOXD1 as one of the functional targets of miR-17-92-1-5p in gastric cells. FOXD1 was found to be dysregulated in several kinds of solid tumour including gastric cancer and inhibit NF-κB activation, particularly of the RELA (p65) subunit.34 46 47 Upregulation of CDX2 were proved to be one of the results of chronic inflammation and associated continuous activation of NF-κB in gastric IM.17 18 Here, we showed evidences that miR-92a-1–5p may regulate CDX2 expression through a FOXD1-NF-κB pathway. We further found that FOXD1 may regulate activation of NF-κB through transcription of FOXJ1 and IκBβ. Nevertheless, further explorations in future studies will be needed on other pathways mediating the effects of FOXD1 on NF-κB pathway. We also provided evidences showing that NF-κB directly binds to the two sites (−1029 ~ −1019 bp and −489 ~ −479 bp) on the promoter of CDX2 to promote its transcription. These findings are consistent with several studies showing that bile salts activated CDX2 transcription through phosphorylation of p65 in Barrett’s metaplasia.37 Interestingly, other studies in gastric cells also showed that CDX2 upregulation in gastric IM may also be due to activation of NF-κB, while focusing on the pathogen of H. pylori.35 48 However, this is the first study that showed evidences that bile acids as an important carcinogen for gastric cancer besides Hp, promotes CDX2 expression through a miR-92a-1–5p/FOXD1/NF-κB axis. This axis was identified by integrating mRNA/miRNA array results, GO analysis and miRNA-target analysis, which helps understand the mechanism underlying the transdifferentiation of gastric cells and our previous findings showing increased miR-92a levels in the serum of IM patients.25 Besides FOXD1, the function of other irregulated genes in CDCA-treated cells such as TGFB2, CCL2 and SMAD7, were also important functional regulators in inflammation, carcinogenesis or differentiation,49 50 which should be focused on in further exploration of gastric IM mechanism.
In summary, we elucidated a schematic model of gastric IM development (figure 7G. This figure depicts that in gastric epithelia cells, bile acids-associated gastritis induces upregulation of miR-92a-1–5p, leading to a decrease of FOXD1 and a continuous activation of NF-κB pathway, which in turn promotes the transcription of CDX2 and intestinal differentiation. Therefore, miR-92a-1–5p may serve as a coordinated regulator of the transcriptional phenotypes necessary for the evolution and progression metaplastic lineages in the stomach. This new miR-92a-1–5p/FOXD1/NF-κB pathway may help understand the mechanism underlying the regulation of CDX2 in gastric IM and shed new lights in the early detection and prevention of gastric cancer. Suppression of miR-92a-1–5p and restoration of FOXD1 may be a preventive approach for gastric IM in patients with bile regurgitation.
References
Footnotes
TL, HG, HL and YJ contributed equally.
Contributors All authors included in this paper fulfill the criteria of authorship and have approved the submission of this manuscript. Specific contributions are as follows:. TL: design of study; technical and material support; analysis and interpretation of data; critical revision of manuscript; important intellectual content; drafting of manuscript. HG: design of study; technical and material support; analysis and interpretation of data; critical revision of manuscript; important intellectual content; drafting of manuscript. HL: design of study; technical and material support; analysis and interpretation of data; critical revision of manuscript; important intellectual content; drafting of manuscript. YJ: design of study; technical and material support; analysis and interpretation of data; important intellectual content; drafting of manuscript. KZ: technical and material support; important intellectual content, interpretation of data. CL: technical and material support; important intellectual content. JW: technical and material support; important intellectual content. HZ: technical and material support; important intellectual content. RZ: technical and material support; important intellectual content. XZ: technical and material support; important intellectual content. YL: technical and material support; important intellectual content. CS: technical and material support; important intellectual content. YN: analysis and interpretation of data; technical and material support; important intellectual content. KW: analysis and interpretation of data; critical revision of manuscript; important intellectual content. ZY: study concept; critical revision of manuscript; technical and material support; important intellectual content. D-MF: study concept; analysis and interpretation of data; critical revision of manuscript; important intellectual content. YS: study concept/design; analysis and interpretation of data; critical revision of manuscript; important intellectual content; drafting of manuscript.
Funding This work was supported by grants from National Key R&D Program of China (2018YFC1311505; 2018YFC1311504), National Natural Science Foundation of China (81430072 D-MF; 81270445 YS; 81370484 N Liu; 81470805 YS; 81400583 HG; 91639301 ZY), Shaanxi Foundation for Innovation Team of Science and Technology (S2018-ZC-TD-0069 YS), the Major Projects of Ministry of Science and Technology (2012ZX09303011-001, D-MF) and the Key Project of Research and Development Plan of Shaanxi Province (2017ZDCXL-SF-02-04-01, ZY).
Competing interests None declared.
Patient consent Obtained.
Ethics approval This study was approved by the Hospital’s Protection of Human Subjects Committee.
Provenance and peer review Not commissioned; externally peer reviewed.