Article Text

Abstract
Background and aims Chronic inflammation induced by chronic hepatitis B virus (HBV) infection increases the risk of hepatocellular carcinoma (HCC). However, little is known about the immune landscape of HBV-related HCC and its influence on the design of effective cancer immunotherapeutics.
Methods We interrogated the immune microenvironments of HBV-related HCC and non-viral-related HCC using immunohistochemistry and cytometry by time-of-flight (CyTOF). On identifying unique immune subsets enriched in HBV-related HCC, we further interrogated their phenotypes and functions using next-generation sequencing (NGS) and in vitro T-cell proliferation assays.
Results In-depth interrogation of the immune landscapes showed that regulatory T cells (TREG) and CD8+ resident memory T cells (TRM) were enriched in HBV-related HCC, whereas Tim-3+CD8+ T cells and CD244+ natural killer cells were enriched in non-viral-related HCC. NGS of isolated TREG and TRM from HBV-related HCC and non-viral-related HCC identified distinct functional signatures associated with T-cell receptor signalling, T-cell costimulation, antigen presentation and programmed cell death protein 1 (PD-1) signalling. TREG and TRM from HBV-related HCC expressed more PD-1 and were functionally more suppressive and exhausted than those from non-virus-related HCC. Furthermore, immunosuppression by PD-1+ TREG could be reversed with anti-PD-1 blockade. Using multiplexed tissue immunofluorescence, we further demonstrated that TREG and TRM contributed to overall patient survival: TREG were associated with a poor prognosis and TRM were associated with a good prognosis in HCC.
Conclusion We have shown that the HBV-related HCC microenvironment is more immunosuppressive and exhausted than the non-viral-related HCC microenvironment. Such in-depth understanding has important implications in disease management and appropriate application of immunotherapeutics.
- hepatitis B
- hepatocellular carcinoma
- immunotherapy
- cancer immunobiology
- immunoregulation
This is an open access article distributed in accordance with the Creative Commons Attribution Non Commercial (CC BY-NC 4.0) license, which permits others to distribute, remix, adapt, build upon this work non-commercially, and license their derivative works on different terms, provided the original work is properly cited, appropriate credit is given, any changes made indicated, and the use is non-commercial. See:http://creativecommons.org/licenses/by-nc/4.0/.
Statistics from Altmetric.com
Significance of this study
What is already known on this subject?
The tumour microenvironment (TME) of HBV-related HCC has mostly been studied in the context of one particular immune subset or by comparing the HBV-related HCC with livers from patients with chronic HBV infection or healthy individuals.
A comprehensive and multidimensional analysis focusing on HBV-related HCC versus non-viral-related HCC is lacking.
What are the new findings?
We analysed the TME of HBV-related HCC in comparison to non-viral-related HCC using CyTOF and NGS.
We identified distinct immune subsets enriched in both HCC aetiologies, and found that the HBV-related HCC immune landscape consisted of more immunosuppressive and exhausted phenotypes.
TREG and rTRM that are enriched in HBV-related HCC are associated with overall patient survival in opposing directions.
How might it impact on clinical practice in the foreseeable future?
An in-depth understanding of the TME in HBV-related versus non-viral-related HCC will allow us to design rational combinatory immunotherapy specific for each aetiology.
Novel immunotherapeutics that target unique pathways in either HBV-related HCC or non-viral-related HCC could be designed for better disease management.
Introduction
Hepatocellular carcinoma (HCC) is one of the most common cancers among males and the third most common cause of cancer-associated death, globally. HBV infection is the single most common cause of HCC; up to 400 million individuals worldwide are living with a chronic HBV infection and are at high risk of developing HCC, with the majority of cases found in Asia and Africa.1 2
The different aetiologies of HCC, particularly those arising from chronic viral hepatitis, are well described, but their impact on the tumour microenvironment (TME) and the subsequent implications on disease management are not well understood. Much research in this area has focused on one single immune subset or has compared the immune profile of viral-related HCC with healthy livers or livers exposed to chronic hepatitis virus infection.3 4 A comprehensive study on the distinct immune landscapes and the underlying mechanisms in HCC with or without chronic HBV infection remains unexplored. There is a general consensus that the immune system is pivotal in determining the clinical fate of patients with HCC.5 Viruses may also reprogramme their immune microenvironment to induce immunosuppression, peripheral tolerance during chronic infection and ultimately, tumourigenesis.6 Hence, we consider a better understanding of the immune landscapes in HBV-related and non-viral-related HCC will greatly help us evaluate the impact of TME in disease progression and prognosis.
Understanding the composition of the immune landscape within a cancer is also central to our understanding of responsiveness to immunotherapy. Recent breakthroughs in cancer immunotherapy, especially the development of immune checkpoint inhibitors, have yielded promising outcomes in clinical trials for multiple cancers, including HCC.7 8 Despite these advances, fundamental differences in patient responsiveness to such therapies are unexplained. Some have attributed these differences to the mutational burden of the tumour9 or the presence of neo-antigen-specific T cells,10 whereas others have highlighted the importance of tumour-immune infiltrates.11 Large-scale transcriptomic and immunogenetics analyses stratifying cancer immune landscapes in the attempt to shed light on this area were also recently reported.12 13 The response rate to the checkpoint inhibitor, nivolumab (anti-PD-1 monoclonal antibody) for HCC is ~15%–20%, and no marked difference between HBV-related or non-viral-related HCC has been identified.14 Little is known regarding the mechanisms underlying the patient response to treatment. Over recent years, we and others have used CyTOF that simultaneously analyse single cells for ≤41 cellular parameters to immunophenotype a number of diseases, including HCC.15–17 Such multidimensional analyses have helped us gain a deep understanding of the TME and its influence on disease progression and response to immunotherapy.
Here, we combined CyTOF, NGS and multiplexed tissue immunoflorescence (IF) to compare the immune landscapes between HBV-related HCC and non-viral-related HCC. By this method, we identified several distinct immune populations specific to HBV-related HCC with unique functionality, and determined their impact on the overall survival (OS) of affected patients.
Materials and methods
Patients
Fresh tumour tissues, adjacent non-tumour tissues and blood samples were collected from 23 patients with HCC who underwent surgical resection at the National Cancer Center Singapore or Singapore General Hospital (SGH) (online supplementary table S1). Tumour-infiltrating leukocytes (TILs) and non-tumour-infiltrating leukocytes (NILs) were isolated using 100 U/mL collagen intravenously. Peripheral blood mononuclear cells (PBMCs) were isolated from preoperative blood samples using Ficoll-Pague Plus (GE Healthcare), as previously described.18 Formalin-fixed and paraffin-embedded (FFPE) tissue-microarray (TMA) slides were obtained from an independent HCC cohort (n=102) from the Department of Pathology, SGH (online supplementary table S2). A further set of FFPE tissues of resected HCC (n=116 patients) were collected from SGH (n=37); the Queen Mary Hospital, Hong Kong (n=42) and the University Hospital Zurich, Switzerland (n=37) (online supplementary table S3). Patient consents were obtained following the guidelines of each Institutional Review Board.
Supplementary file 1
Cytometry by time-of-flight
TILs, NILs and PBMCs from 23 patients with HCC (online supplementary table S1) were analysed by CyTOF, with or without 5-hour stimulation with phorbol 12-myristate 12-acetate (PMA)/Ionomycin as previously described.16 Briefly, the cells were thawed and rested overnight in Roswell Park Memorial Institute media with 10% human serum and stained with a panel of 35 antibodies (online supplementary table S4) and three anti-CD45-antibody barcodes for simultaneous sample processing as previously described.19 The generated files were debarcoded (CD45+), gated based on size and DNA content labelled with a DNA-intercalater (DVS Sciences) and live cells that were negative for cisplatin. The individual files were downsampled to 10 000-live CD45+ immune cells and analysed using in-house developed Multidimensional-Automated Reduction and Visualisation software17 based on a combination of non-linear dimensionality reduction algorithm (Barnes-Hut SNE) and k-means-clustering algorithm.20 The CyTOF data were also independently validated using FlowJo software (V.X.0.7, Tree Star) (onlinesupplementary table S1).
Next-generation sequencing
TILs were isolated from HBV-related HCCs (n=3–4) and non-viral-related HCCs (n=3) and stained with surface markers: CD45, CD3, CD4, CD8, CD45RO, CD103 (all from Biolegend), and PD-1 (BD Biosciences). regulatory T cells (TREG) (CD4+CD25+CD127-) and resident memory T cells (TRM; CD8+CD103+CD45RO+) were sorted using a FACSAria-III (BD Biosciences) with 95%–99% purity. Total RNA was isolated using a Picopure RNA-Isolation kit (Arcuturus, Ambion) and cDNA was generated using SMART Seqv4 UltraLow Input RNA Kit (Clontech), both according to manufacturer’s instructions. Illumina-ready libraries were prepared from cDNA using the Illumina-NexteraXT DNA-Library-Prep Kit (Illumina). Sequencing was performed at the NGS Platform of Genome Institute of Singapore on a HiSeq 2500 platform using HighOutput V.3.
Raw sequencing reads were mapped via Hierarchical Indexing for Spliced Alignment of Transcripts with reference to the Human-Assembly-GRCh38.p7 from Ensembl. Aligned reads were then sorted using SAMtools and the raw gene counts were extracted with high-throughput sequencing data.21 The edgeR tool was used to analyse the differential gene expression between two sample groups. The empirical Bayes quasi-likelihood F-test was used in the Generalised Linear Model pipeline for gene-wise statistical analyses. Genes with a fold-change >2 and p<0.01 were selected. The data were then visualised in heat maps using R-Script and further annotated with Reactome Pathway Analysis.
In vitro T-cell suppression assay
The T-cell suppression assay was performed according to a previously published method that used small numbers of tissue-isolated TREG.22 Briefly, TILs were stained with the following anti-human antibodies: CD45, CD3, CD4, CD8, CD25, CD45RO, CD103, CD127 (all from Biolegend) and PD-1 (BD Biosciences). Concurrently, autologous PBMCs were prelabelled with CellTrace Violet dye (C34557, Life Technologies) and then stained with antihuman antibodies: CD45, CD3, CD4, CD25 and CD127. The FACSAria-III (BD Biosciences) was used to isolate PD-1+ TREG or PD-1- TREG (PD-1+/PD-1-CD45+CD3+CD4+CD25+CD127locells) and TRM or non-TRM (CD103+/CD103-CD45+CD8+CD45RO+cells) from the TILs and CellTrace Violet-labelled responder T cells (Tresp; CD45+CD3+CD4+CD25-CD127hicells) from the autologous PBMCs (n=7 HBV-related HCCs from online supplementary table S1). Tresp cells were cocultured in 96-well plates for 5 days with either PD-1+TREG, PD-1-TREG, TRM or non-TRM at a 1:1 ratio (20 000 cells each), with or without 20 000 Human TREG Suppression Inspector beads (Miltenyi Biotec). In a separate experiment, the suppression assay was performed with antihuman PD-1 or programmed death-ligand 1 (PD-L1) antibodies with their respective isotype control antibody (all from Biolegend). At the end of these experiments, the cells were harvested and the signal from the CellTrace Violet dye was analysed using a BD LSR FORTESSA with five lasers (BD Biosciences). Data analysis was performed using FlowJo software.
Multiplex tissue IF
Multiplex tissue IF was performed using an OpalMultiplex Immunohistochemistry system and images were acquired on a Vectra 3.0 Automated Quantitative Pathology Imaging System (Perkin Elmer), as previously described.23 4′,6-Diamidino-2-phenylindole was used as the nuclear marker, and the antibodies used are listed in online supplementary table S5. Quantification of positively stained cells was performed using the Vectra 3.0 System and verified by manual counting of 5–10 random fields at 100× magnification. The mean number from all fields from each patient sample was used to calculate the cellular density (number/mm2).
Statistical analysis
A Mann-Whitney U test was used in Forest Plot for analysing differential nodes between two groups of clusters. The edgeR package24 was used for differential expression analysis of the RNA-seq data. FlowJo data analyses were performed using the Mann-Whitney U test or paired Student’s t-test, both two-sided and two-way analysis of variance test with Tukey’s multiple comparison post-tests (GraphPad Prism V.6.0f). Univariate and multivariate analyses were performed using Cox proportional hazards models.
Results
HBV-related HCC and non-viral-related HCC are composed of distinct immune subsets
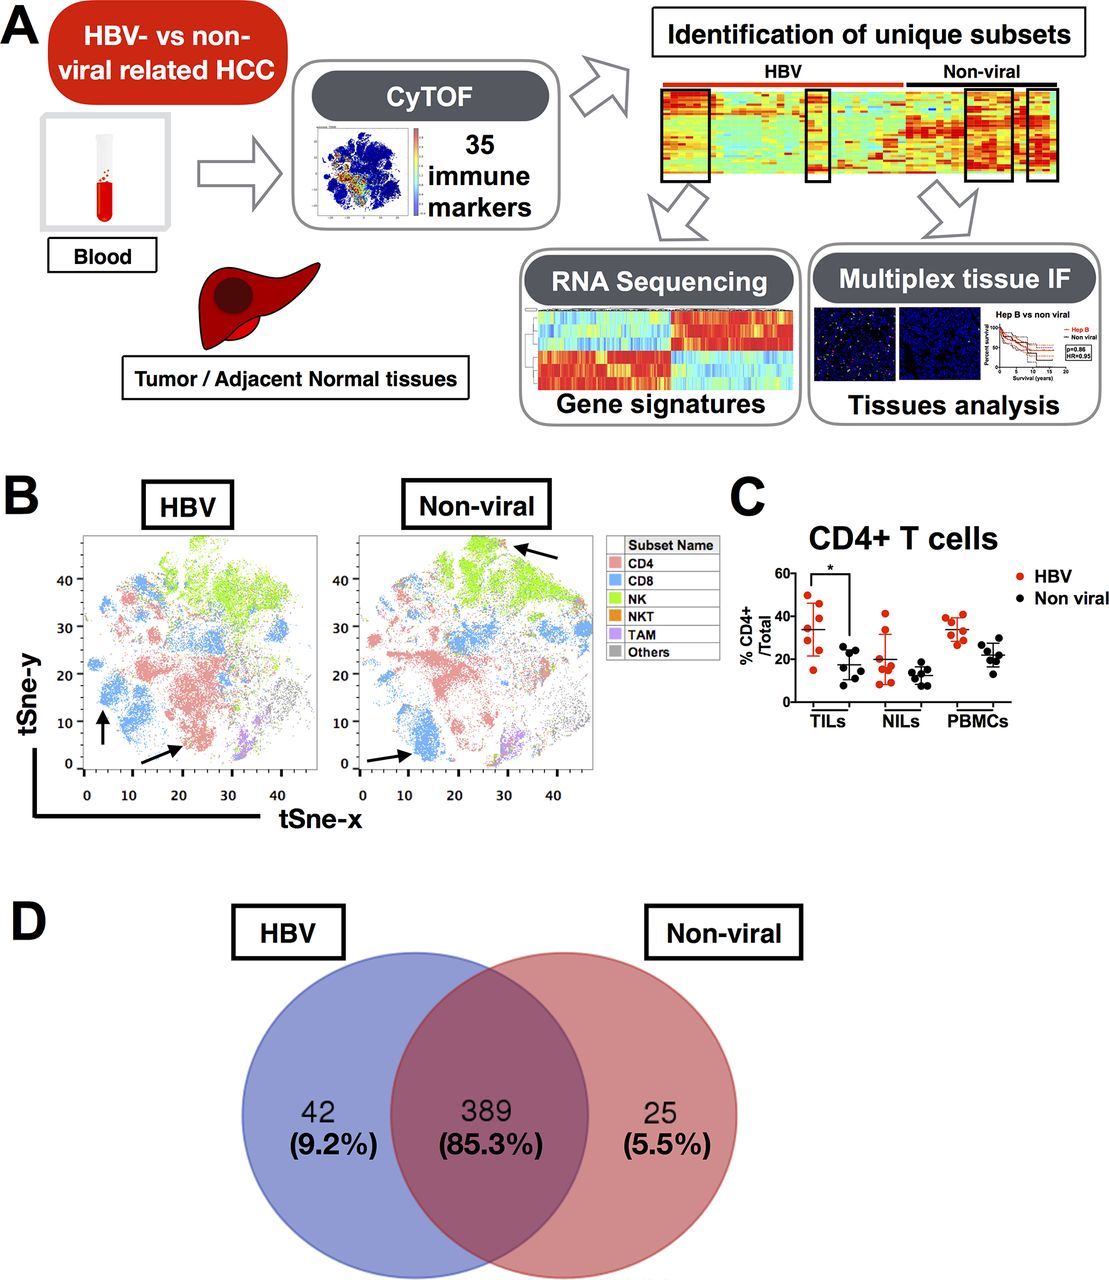
Based on the hypothesis that chronic HBV infection would have a significant impact on TME of HCC, we first aimed to determine whether the TMEs of HBV-related HCC and non-viral-related HCC are distinct. Here, we used CyTOF to perform an in-depth immunoprofiling of the immune landscapes of both HCC aetiologies. Our CyTOF panel consisted of 35 surface and intracellular immune markers (online supplementary table S4) that could examine the global immune phenotypes of TILs, NILs and PBMCs from HBV-related (n=12) and non-viral-related (n=11) HCC tumours (figure 1A and online supplementary table S1). The distributions of the immune lineages from HBV-related HCC versus non-viral-related HCC TILs (including CD8+ T cells, CD4+ T cells, CD56+ natural killer (NK) cells, CD3+CD56+ NKT cells and CD14+ tumour-associated macrophages (TAM)) were presented as two-dimensional (2D) t-SNE plots (figure 1B). The percentages of each immune lineage were manually gated using FlowJo in each individual TIL, NIL and PBMC, which validated the enrichment of CD4+ T cells in TILs from HBV-related HCC (figure 1C). Of note, the other major lineages and the TIL density showed no significant differences between the two HCC subtypes (data not shown).

Immune landscape of HBV-related HCC. (A) Study pipeline: TILs, NILs and PBMCs were collected from blood samples and tumour and adjacent tumour tissue from patients with HBV-related HCC and non-viral HCC and were analysed by CyTOF. Unique immune subsets were identified by CyTOF analysis and sorted for further analysis using RNA sequencing. Independent validation was performed using multiplex tissue immunofluorescence on FFPE patient samples. (B) Two-dimensional t-SNE illustration of the CyTOF data of TILs isolated from HBV-related HCC and non-viral-related HCC, gated (with colour coding) on CD4+ T cells, CD8+ T cells, CD56+ NK cells, CD3+CD56+ NKT cells and CD14+HLA-DR+TAM. Arrows showed enriched clusters in each HCC. (C) Percentages of CD4+ T cells from TILs, NILs and PBMCs in HBV-related HCC vs non-viral-related HCC, manually gated using FlowJo software (n=7 for each group). Data represent the means±SD; *p<0.05 (unpaired Student’s t-test). (D) Venn diagram showing the number (and percentage) of common and differentially expressed nodes between HBV-related HCCs and non-viral-related HCCs. CyTOF, cytometry by time-of-flight; FFPE, formalin-fixed and paraffin-embedded; HCC, hepatocellular carcinoma; NIL, non-tumour-infiltrating leukocytes; NK, natural killer; PBMC, peripheral blood mononuclear cells; TAM, tumour-associated macrophages; TIL, tumour-infiltrating leukocytes.
Next, we performed dimensional reduction and clustering of our CyTOF data to generate nodes (immune subsets) with similar immune-marker expression profiles, as previously described.16 A total of 456 nodes were produced, and after applying Mann-Whitney U test, we found that 389 nodes (85.3%) were shared between the two HCC subgroups and 42 (9.2%) and 25 (5.5%) nodes were enriched in HBV-related HCC and non-viral-related HCC, respectively (figure 1D). These data indicate that the general immune landscapes of HBV-related and non-viral-related HCC are very similar, with <10% difference in the immune populations enriched in each HCC subtype.
TREG and TRM cells are enriched in HBV-related HCC, and Tim-3+CD8+ T cells and CD244+ NK cells are enriched in non-viral-related HCC
We further interrogated the frequency of differentially expressed nodes in HBV-related and non-viral-related HCC (figure 2A) and generated a 2D heat map of the marker expression profiles for these differentially expressed nodes (figure 2B). Here, we observed overall higher expression of multiple pro-inflammatory markers in non-viral-related HCC, namely interferon (IFN)-γ, interleukin (IL)-17a, granzyme B and tumour necrosis factor (TNF)-α (figure 2B). This observation is consistent with the hypothesis that chronic HBV infection leads to an immunosuppressive microenvironment.25

Immune subsets enriched in HBV-related HCC and non-viral-related HCC. (A) Frequency of differentially expressed nodes (immune subsets) in HBV-related HCC vs non-viral-related HCC, identified by unpaired Mann-Whitney U test. Each colour gradient represents a single patient. (B) Two-dimensional heat map showing the differential expression of 35 immune markers in HBV-related TILs (red bars) or non-viral-related TILs (black bars). The immune subsets that represent these nodes based on their markers expression are noted. Boxes show the major distinct immune subsets enriched in either of the TILs. (C) Percentages of TREG (CD4+Foxp3+CTLA-4+), TRM (CD8+CD103+CD69+), Tim-3+CD8+ T cells and CD244+ NK cells from TILs, NILs or PBMCs from either HBV-related HCC or non-viral-related HCC as obtained by manual gating using FlowJo software. Data represent the means±SD; two-way analysis of variance test with Tukey’s multiple comparison post-tests. Pi=interaction p value (interaction between viral status and TILs/NILs/PBMCs); Pr=row factor (viral status) p value; Pc=column factor (TILs/NILs/PBMCs) p value; *p<0.05, **p<0.01, ***p<0.001. HCC, hepatocellular carcinoma; NIL, non-tumour-infiltrating leukocytes; NK, natural killer; ns, non-significant; PBMC, peripheral blood mononuclear cells; TIL, tumour-infiltrating leukocytes.
We also noted distinct subsets that could differentiate HBV-related HCC TILs from non-viral-related HCC TILs. These subsets included TREG (CD4+CTLA-4+Foxp3+) and TRM (CD8+CD103+CD45RO+CD69+) that were enriched in the HBV-related HCC TILs and Tim-3+CD8+ T cells and CD244+CD56+NK cells that were enriched in the non-viral-related HCC TILs (figure 2B and online supplementary figure S1A-C). Other immune subsets, such as CD4+ T cells, CD8+ T cells and CD14+ TAM showed only subtle differences between the two groups (figure 2B). Manual gating using FlowJo (online supplementary figure S2A-C) confirmed that TREG and TRM were indeed enriched in the TILs from HBV-related HCC (figure 2C). Further analyses showed that TREG were specifically enriched in TILs compared with NILs and PBMCs, and TRM were enriched in TILs compared with PBMCs in HBV-related HCC (figure 2C). Conversely, Tim-3+CD8+ T cells and CD244+CD56+ NK cells were enriched in the non-viral-related TILs (figure 2C). Taken together, the immune landscape of HBV-related HCC is distinct from non-viral-related HCC with the enrichment of TREG and TRM.
TILs from HBV-related HCC express more PD-1
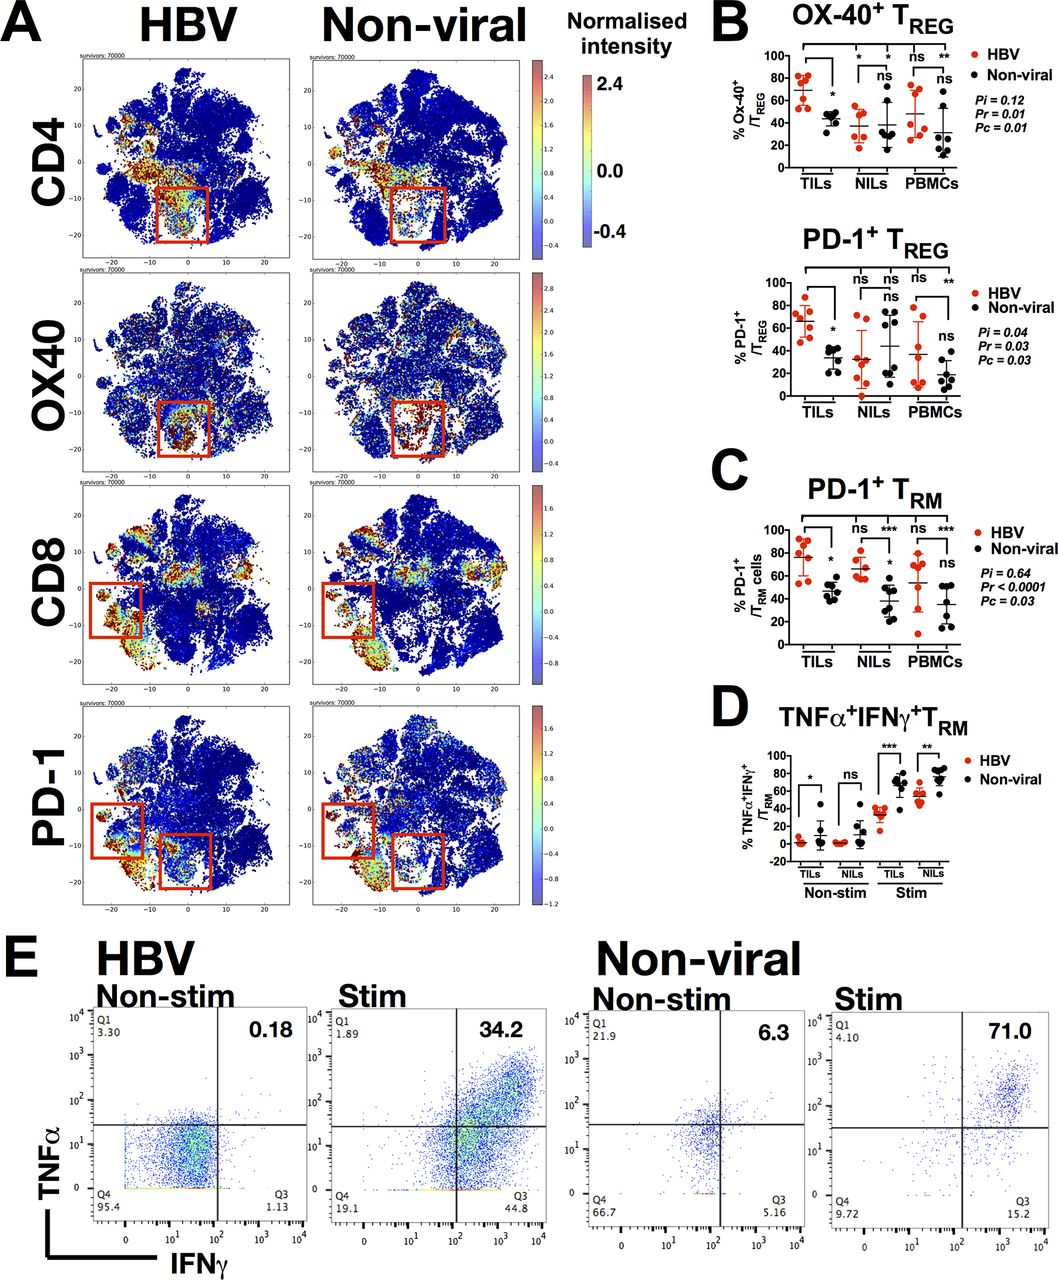
As shown in our CyTOF data, the TME of HBV-related HCC was distinct from that of the non-virus-related HCC. We further investigated immune marker expression in TILs between the two groups (online supplementary figure S3A-E), and specifically compared the expression of different costimulatory and coinhibitory molecules (online supplementary figure S3E). Here, we found marked differences in OX40 expression on CD4+ T cells and PD-1 expression on both CD4+ T cells and CD8+ T cells (figure 3A). Further interrogation of OX40 and PD-1 expression on TREG cells (which were enriched in HBV-TILs) demonstrated that TREG from HBV-related HCC indeed expressed more OX40 and PD-1 compared with non-virus-related HCC (figure 3B). Similarly, TRM of both TILs and NILs from patients with HBV-related HCC expressed more PD-1 compared with non-virus-related HCC (figure 3C).

Phenotypes of TREG and TRM enriched in HBV-related HCC. (A) Two-dimensional cellular t-SNE plots from the CyTOF data showing differentially expressed markers for TILs isolated from HBV-related HCC vs non-viral-related HCC. The red boxes indicate nodes enriched in either HBV-related HCCs or non-viral-related HCCs, respectively. (B) Percentage of Ox-40+ and PD-1+ TREG. (C) Percentage of PD-1+ TRM. (D) Percentage of TNF-α+IFN-γ+TRM non-stimulated (Non-stim) or stimulated (Stim) with PMA/Ionomycin. (E) Representative plots showing expression of TNF-α and IFN-γ on TRM from HBV-related or non-viral-related HCC non-stimulated (Non-stim) or stimulated (Stim) with PMA/Ionomycin. B–D: Data were obtained by manual gating using FlowJo software and each graph represent the means±SD; B and C: two-way analysis of variance test with Tukey’s multiple comparison post-tests. Pi=interaction p value (interaction between viral status and TILs/NILs/PBMCs); Pr=row factor (viral status) p value; Pc=column factor (TILs/NILs/PBMCs) p value; D: unpaired Student’s t-test. *p<0.05, **p<0.01, ***p<0.001. CyTOF, cytometry by time-of-flight; HCC, hepatocellular carcinoma; IFN, interferon; NIL, non-tumour-infiltrating leukocytes; ns, non-significant; PBMC, peripheral blood mononuclear cells; PD-1, programmed cell death protein 1; TIL, tumour-infiltrating leukocytes; TNF, tumour necrosis factor.
We then examined whether higher PD-1 expression on TRM from HBV-related HCC corresponded to lower expression of TNF-α and IFN-γ on stimulation by PMA/Ionomycin. Indeed, PD-1-expressing TRM from HBV-related HCC expressed less TNF-α and IFN-γ when compared with that from non-viral-related HCC when stimulated with PMA/Ionomycin (figure 3D and figure 3E). In general, TILs from HBV-related HCC exhibited higher PD-1 expression and a more exhausted phenotypes than non-viral-related HCC, which is consistent with our hypothesis and previous data that chronic HBV infection induces an immunosuppressive TME. Despite this finding, the ability of stimulated TRM to express pro-inflammatory cytokines indicated that they remained functionally competent and cytotoxic when appropriately activated intratumourally.
TREG and TRM isolated from HBV-related or non-viral-related HCC have distinct transcriptomic signatures
As our data showed that TREG and TRM were enriched in the TME of HBV-related HCC, we decided to examine whether these cells had unique functions or transcriptomic profiles depending on whether they reside in HBV-related or non-viral related HCC. To this aim, we isolated CD4+CD25+CD127-TREG and CD8+CD103+CD45RO+TRM from HBV-related (n=3 or 4) and non-viral-related (n=4) HCCs and performed NGS on these sorted cells (online supplementary figureS4A). The NGS results showed differential gene signatures of both TREG and TRM from HBV-related and non-viral-related HCC (figure 4A), with a total of 289 and 166 differentially expressed genes, respectively. We analysed the enriched genes from the TREG (58 genes) and TRM (111 genes) isolated from HBV-related HCC using the Reactome functional analysis tool (figure 4B, online supplementary table S6 and S7).
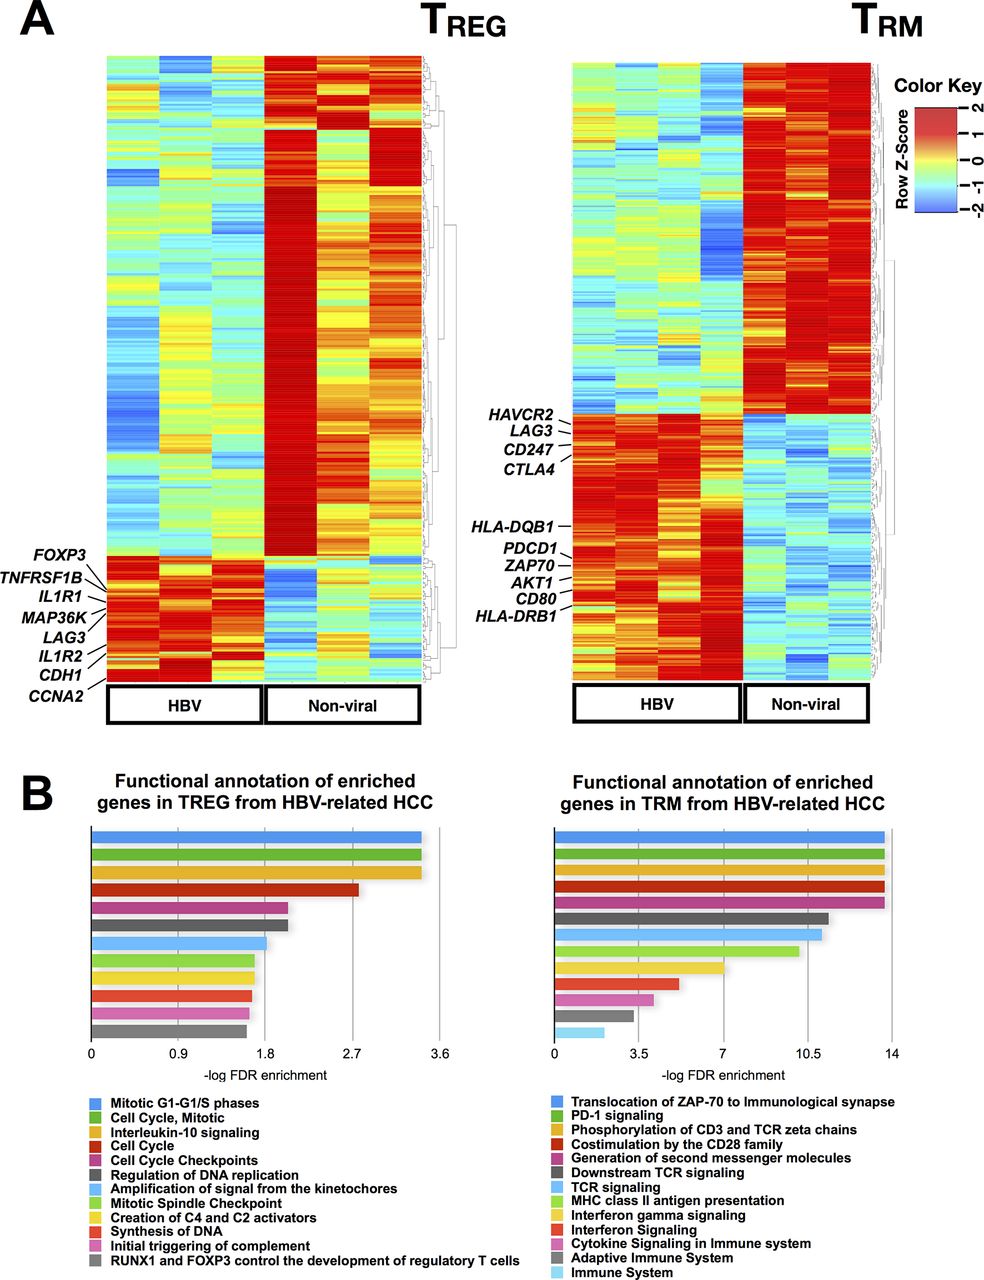
Transcriptome analysis of TREG and TRM isolated from HBV-related HCC vs non-viral-related HCC. (A) Differentially expressed genes identified by NGS analysis on TREG and TRM isolated from HBV-related HCC vs non-viral-related HCC. (B) Reactome pathway analysis of the enriched genes identified from TREG and TRM isolated from HBV-related HCCs compared with non-viral-related HCC. HCC, hepatocellular carcinoma; NGS, next-generation sequencing.
TREG from HBV-related HCC showed higher expression of FOXP3 (figure 4A) and other genes involved in the IL-10 signalling pathway such as IL1R1 and TNFRSF1B (figure 4B and online supplementary table S6), indicating a more immunosuppressive phenotype of TREG isolated from HBV-related HCC compared with TREG from non-virus-related HCC. IL-10 signalling has also been shown to sustain FOXP3 expression, thereby stabilising TREG’s phenotypes and functions.26 LAG3, an exhaustion-related gene was also enriched in TREG from HBV-related HCC (figure 4A) and it was previously reported to be important for its maximal suppressive activity.27 Furthermore, it was reported that LAG-3 expressing TREG were enriched in the tumour microenvironment and were immunosuppressive based on their high expression of IL-10 and transforming growth factor (TGF)-β.28 The notable upregulation of cell cycle-related pathways (figure 4B) suggests that these TREG were proliferative. Taken together, these findings were consistent with our earlier data that demonstrated a more immunosuppressive phenotype of TREG from HBV-related HCC compared with non-viral-related HCC.
Genes enriched in TRM from HBV-related HCC exhibited a state of exhaustion, as implicated by the higher expression of exhaustion marker genes such as PDCD1 (PD-1), LAG3, HAVCR2 (Tim-3) and CTLA4 (figure 4A and online supplementary table S7). These data were again consistent with our CyTOF analysis and support our hypothesis of an exhausted TME in HBV-related HCC. Other common pathways related to genes enriched in TRM from HBV-related HCC included IFN signalling, cytokine signalling and adaptive immune system which may indicate a prior activation leading to exhaustion in these cells (figure 4B). In conclusion, our transcriptome analysis of TREG and TRM further validated that the TME of HBV-related HCC is more immunosuppressive/exhausted than non-viral HCC.
PD-1hi TREG is more immunosuppressive and their phenotype can be diminished on PD-1/PD-L1 blockade
We next investigated the functions of TREG and TRM from HBV-related HCC using an in vitro T-cell suppression assay.22 As HBV-related HCC was enriched with PD-1+ TREG (figure 3B), we first aimed to address whether PD-1+TREGand PD-1- TREG are functionally distinct. We isolated PD-1+TREGand PD-1- TREG together with TRM and non-TRM from HBV-related HCC tumours to examine their ability to suppress the proliferation of CD4+CD127+CD25- Tresp cells isolated from autologous PBMCs (online supplementary figure S5A and figure S5B). Indeed, we observed significant suppression of Tresp cell proliferation by both PD-1+TREGand PD-1- TREG, with PD-1+ TREG being significantly more suppressive than its PD-1- counterpart (figure 5A and online supplementary figure S6A) despite the fact that they express comparable level of Foxp3 (supplementary figure S5A). TRM had no significant effect on suppressing proliferation of Tresp cells (figure 5A) indicating that despite their exhausted phenotypes they did not have immunosuppression function. To further interrogate whether suppression of T-cell proliferation mediated by PD-1+ TREG cells could be blocked, we repeated the experiments and incubated the PD-1+ TREG with either anti-PD-1 or anti-PD-L1 antibodies. The suppressive effect of PD-1+ TREG was significantly reduced on exposure to either anti-PD-1 or anti-PD-L1 antibodies (figure 5B and online supplementary figure S6B) compared with control isotype antibody. Of note, our CyTOF data showed that PD-1+ TREG also expressed PD-L1 (online supplementary figure S5C). In addition, we found that the suppressive phenotype of TREG remained unaffected by coculturing with TRM, another HBV-TIL-enriched subset (figure 5C).
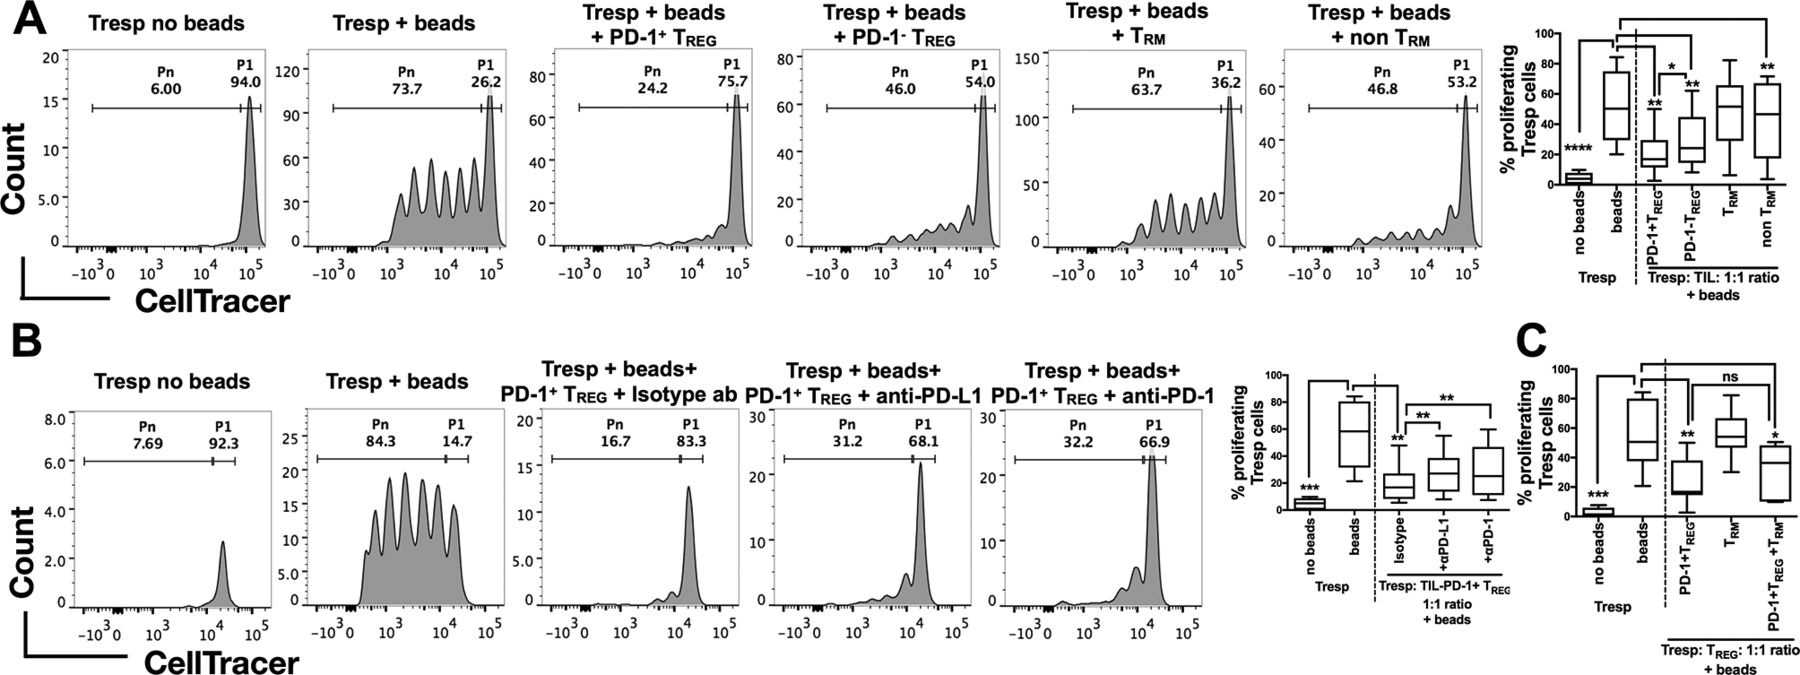
Suppressive functions of TREG isolated from HBV-related HCC. (A) Representative analysis of CellTrace Violet-labelled Tresp cells with or without human TREG suppression inspector beads (upper panel) and with beads as well as different immune subsets isolated from TILs (PD-1+/PD-1- CD4+CD25+CD12 7 -TREG and CD103+/-CD8+CD45RO+ TRM/non-TRM) of HBV-related HCCs (lower panel). P1 denotes the percentage of non-proliferating Tresp and Pn denotes the percentage of proliferating Tresp. The percentages of proliferating Tresp cells under different coculture conditions are shown in the graph on the right (n=7 replicates in each condition). (B) Representative analysis of CellTrace Violet-labelled Tresp cells with or without beads (upper panel) and with beads, PD-1+ TREG and anti-human PD-1, anti-human PD-L1 or control isotype antibody (lower panel). P1 denotes non-proliferating Tresp and Pn denotes proliferating Tresp. The percentages of proliferating Tresp cells under different coculture conditions with or without checkpoint blockade are shown in the graph on the right (n=7 replicates in each condition). (C) Percentages of proliferating Tresp cells when cocultured with PD-1+ TREG, TRM or both TILs combined (n=7 replicates in each condition). A–C: Paired student’s t-test. *p<0.05; **p<0.01; ***p<0.001; ****p<0.0001. HCC, hepatocellular carcinoma; ns, non-significant; PD-1, programmed cell death protein 1; PD-L1, programmed death-ligand 1; TIL, tumour-infiltrating leukocytes
These functional data demonstrate that the TME of HBV-related HCC, which is enriched with PD-1+ TREG (figure 3B), could potentially be more immunosuppressive than the TME of non-virus-related HCC. This immunosuppression could, however, be reversed on application of anti-PD-1/anti-PD-L1 blocking antibodies.
Tumour-infiltrating TREG and TRM have opposing effects on the overall survival in patients with HCC
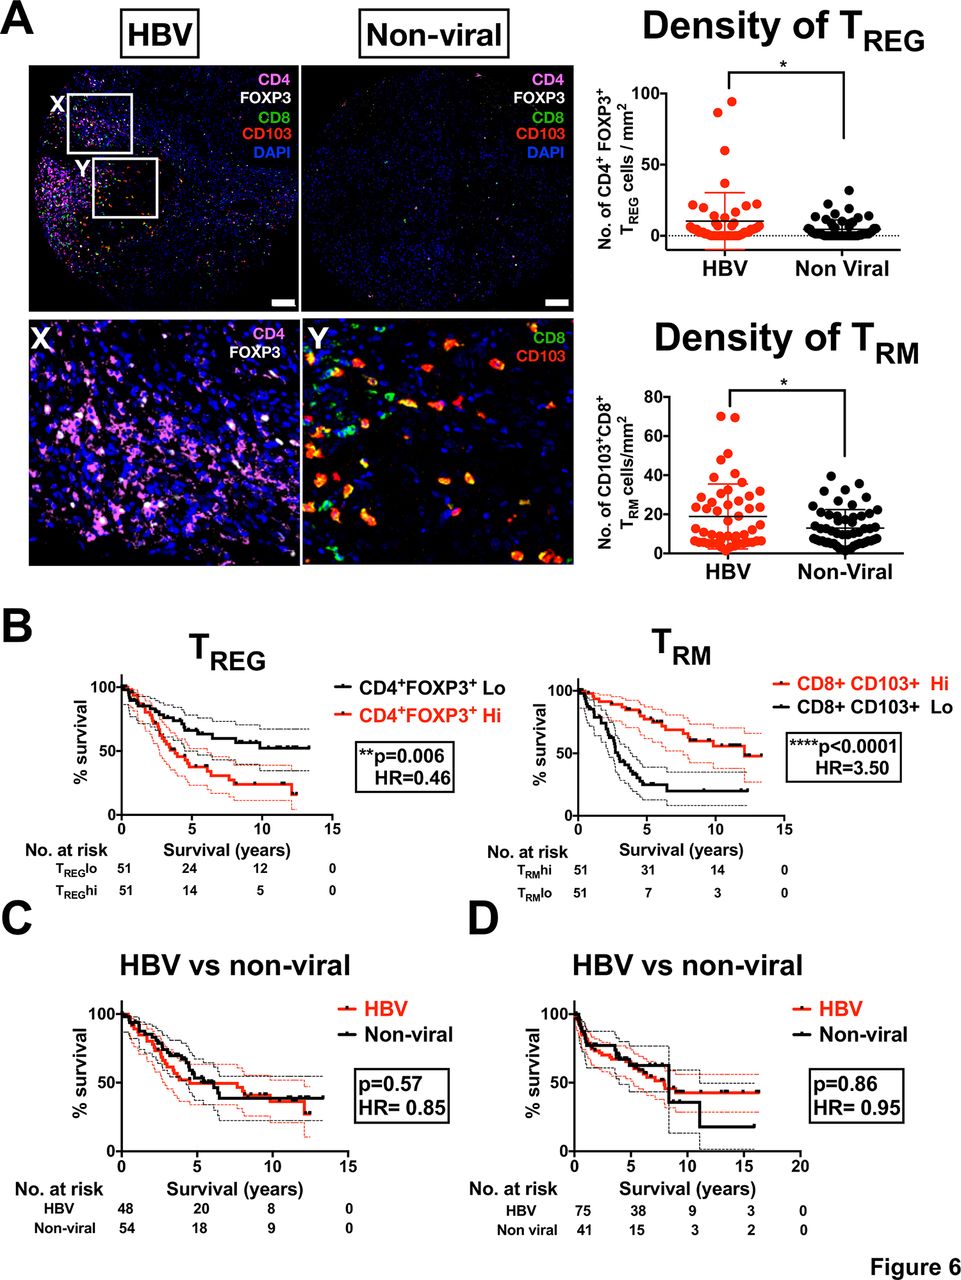
Our data thus far have indicated that TREG and TRM are the two major immune subsets enriched in HBV-related HCC. We then investigated their contribution to the overall survival (OS) of patients with HCC. Using multiplexed tissue IF on TMA cohort (n=102) (online supplementary table S2), we first validated that both TREG (CD4+Foxp3+) and TRM (CD8+CD103+) were enriched in HBV-related HCC compared with non-viral-related HCC (figure 6A). Next, we segregated the patients into high or low TREG or TRM according to median number of cells/mm2 and examined their OS profiles by Kaplan-Meier analysis. Interestingly, we found that these two immune-subsets had an opposing influence on OS: higher numbers of tumour-infiltrating TREG were associated with a poorer survival profile, whereas a higher number of tumour-infiltrating TRM was associated with a better survival profile (figure 6B). These findings are consistent with previous studies that showed tumour infiltration of TREG is associated with poor prognosis in HCC.29 However, the association of TRM to a better prognosis of HCC was an interesting and novel observation. Due to the opposing (balancing) effects of TREG and TRM, we would expect the OS of patients with HBV-related HCC to be equivalent to those with non-viral-related HCC. Indeed, when we compared the OS of patients with HBV-related HCC with those with non-viral-related HCC from the same TMA cohort (n=102), we observed no significant differences (figure 6C). These data were further validated, by analysing the OS of the international HCC cohort from Singapore, Hong Kong and Zurich (n=116; online supplementary table S3 and figure 6D). Furthermore, we performed both univariate and multivariate analyses along with several clinical parameters, and demonstrated that intratumoural TREG and TRM densities were independent and superior prognostic factors for OS in these patients with HCC (table 1). This in-depth analysis of the major immune subsets in HBV-related HCC has identified a complex relationship between immune cell enrichment and the OS profile of patients with HCC.
TREG and TRM enrichment in HBV-related HCC impacts on patient survival. (A) Multiplex immunofluorescence staining of FFPE HCC tissues microarray (n=102) showing enriched TREG (CD4+Foxp3+) and TRM (CD8+CD103+) in tumour tissues from HBV-related HCC vs non-viral-related HCC. Magnification, 10x; scale bar, 50 µm. The lower images show the highlighted boxes (X, Y) at 20x zoom-in, with Foxp3 and CD4 (for TREG) and CD103 and CD8 (for TRM) shown separately. The densities of TREG or TRM (no. of cells/mm2) were shown in the graphs on the right. *p<0.05. (B) Kaplan-Meier analysis showing the overall patient survival profiles based on high (Hi) or low (Lo) TREG or TRM. The cut-off was based on the median density of TREG and TRM, respectively (log-rank test). (C) Kaplan-Meier survival analysis based on viral status in patients with HCC included in the tissue microarray cohort (n=102). (D) Kaplain-Meier survival analysis based on viral status in independent HCC cohort from Singapore, Hong Kong and Zurich (n=112). DAPI, 4′,6-D iamidino-2-phenylindole; FFPE, formalin-fixed and paraffin-embedded; HCC, hepatocellular carcinoma.
Univariate and multivariate analysis with Cox proportional hazard regression model (TMA cohort)
Discussion
Several studies have interrogated the immune landscape of HBV-related HCC,3 4 but most have exclusively focused on a single immune subset or on soley HBV-related HCC without a cross-comparison to non-viral-related HCC. These studies thus provide only a restricted view of the immune landscapes of HCC; a broader understanding is critical to predicting clinical outcomes and designing effective disease-management strategy. Our current study provides a comprehensive examination of the intratumoural immune landscapes of HBV-related HCC compared with non-virally induced HCC, using the high-dimensional analytical tools: CyTOF and NGS. This approach allowed us to address the fundamental impact of the underlying TME on TIL phenotypes. First, we identified the immune subsets that were distinct between the HBV-related and non-viral-related HCC. Specifically, TREG and TRM were enriched in HBV-related HCC and Tim-3+CD8+ T cells and CD244+ NK cells were enriched in non-viral HCC. We could also clearly visualise a more immunosuppressive or exhausted TME in HBV-related HCC. Given that the TREG identified in HBV-related HCC expressed higher levels of PD-1, we tested the effects of PD-1/PD-L1 pathway blockade on TREG function and found that indeed it could diminish the TREG suppressive phenotype. Finally, we described the opposing effects of the two HBV-related HCC-enriched immune subsets, TREG and TRM, on the OS in patients with HCC. As expected, those with high TREG exhibited worse OS, but interestingly, those with high TRM, showed more favourable OS.
Our finding of a higher density of intratumoural TREG in HBV-related HCC is consistent with previous studies that have identified higher TREG numbers in chronic HBV infection.30 Others have also shown that TRM numbers are increased in livers with chronic HBV infection compared with healthy livers.31 Recent large-scale single-cell RNA-sequencing on T cells from a majority of HBV-related HCCs also found that TREG and exhausted CD8+ T cells (with similar gene signatures as our current study) were enriched in the tumour.32 The important roles of NK cells in HBV infection and HCC have been widely described.33 34 CD244/2B4 is important for effective immune control during chronic viral infections35; reduced CD244 on NK cells is associated with increased TGF-β during the immune tolerant phase of persistent HBV infection.36 The lower percentage of CD244+ NK cells from HBV-related HCC in our study is hence consistent with these previous reports. CD244 also mediates the antitumour activity of NK cells,37 which suggests its critical role in non-viral related HCC, that is enriched with CD244+ NK cells. On the contrary, Tim-3 is upregulated on multiple immune subsets, including T cells and NK cells, during chronic HBV infection.38 39 The higher Tim-3+CD8+ levels observed in non-viral HCC in our study thus contrast this general consensus. As many of the previous studies compared the immune profiles of chronic HBV-infected patients with healthy individuals, it is hard to determine whether the same conclusions should have been expected from our study, which compared HCC patients with or without HBV infection.
The immunosuppressive activity of TREG and its role in tumour progression has been well documented in many cancers,40 including HCC.41 A higher density of TREG cells, intratumourally or in the peripheral blood, is considered a poor prognostic marker for survival of patients with HCC,29 as consistent with our current findings. We and others, have also reported CD8 as good prognostic factor in HCC.34 42 TRM was suggested to exert a partial immune response in chronic HBV infection31 and was recently reported to be associated with superior survival in other cancers.43 44 Furthermore, the enrichment of CD80 by TRM from HBV-related HCC shown in our NGS analysis (figure 4A and online supplementary table S6) and the ability to express cytokines on stimulation (figure 3D) suggests potential T-cell cytotoxicity. As such, our study is the first of its kind uniquely describing the opposing effects of these two immune subsets on the OS of patients with HCC.
Increased expression of PD-1 on TREG and TRM in HBV-related HCC is consistent with a virus-induced immunosuppressive/exhausted TME. Our NGS data also supported more immunosuppressive/exhausted phenotypes of TREG and TRM isolated from HBV-related HCC. As both of these populations expressed PD-1, we would assume that application of PD-1 inhibitor would render a survival benefit. This hypothesis, however, was not supported by the results from the recent CheckMate 040 clinical trial that found no significant difference in response rate for patients with HBV-related or non-viral-related HCC towards nivolumab.14 From our current findings, we did observe an alleviated immunosuppressive phenotype when blocking PD-1/PD-L1 pathway on PD-1+TREG cells. By contrast, others have reported that blocking PD-1/PD-L1 pathway would expand the TREG population leading to an overall more immunosuppressive phenotype.45 The higher number of PD-1-expressing TRM cells also does not necessarily translate into an ability to mount an immune response on PD-1 blockade, as some of these PD-1+CD8+ T cells can become terminally exhausted during chronic viral infection.46 The effect of PD-1/PD-L1 blockade on multiple immune subsets in HBV-related HCC requires further investigation. Based on the current findings however, we consider immunotherapies which target TREG and PD-1-expressing cytotoxic T cells would be a rational combinatorial strategy for HBV-related HCC. By contrast, immunotherapies that target NK cells or Tim-3+CD8+ T cells may be more effective in non-viral-related HCC.
In conclusion, our study is one of the most comprehensive analyses in immune landscapes of patients with HCC with or without HBV infection. Such deep immunophenotyping strategies are essential in enhancing our understanding of tumour immunity in cancers derived from different aetiologies and will help guide the design of novel immunotherapeutic strategies.
Acknowledgments
The authors would like to thank Fiona Ni Ni Moe and Phang Su Ting from Singapore General Hospital (SGH), Professor Achim Weber from University Hospital of Zurich and Professor Ronnie Poon from Queen Marry Hospital Hong Kong for coordinating the patient sample collection and for assisting with obtaining patient consents. The authors would like to thank Dr Jing Yao Leong and Suzan Saidin for their assistance in sorting the immune subsets. Finally, the authors would also like to thank Insight Editing London for language editing of this manuscript prior to submission.
References
Footnotes
CJL and YHL contributed equally.
SA and VC contributed equally.
Contributors YHL and CJL performed most experiments, analysed the data and prepared the manuscript; LP analysed the NGS data; LL assisted in CyTOF data acquisition; CC performed RNA sequencing experiments; JY assisted in immune subsets sorting; MW performed univariate and multivariate analyses; TKHL and JY (pathologists) prepared and provided tissue samples; HCT (oncologist) advised on patient recruitment and clinical analysis; SYL, CYC, BKPG and AC (surgeons) assisted in patient recruitment and provided samples; MH (Zurich) and IOLN (Hong Kong) provided samples from overseas cohorts; PC provided clinical advice, recruited and provided samples for most patients; SA designed the study pipeline and assisted in writing the manuscript; VC designed the studies, analysed the data and wrote the manuscript.
Funding This work was supported by the National Medical Research Council, Singapore (ref numbers: MOHIAFCAT2001, TCR15Jun006, CIRG16may048, CSAS16Nov006, NMRC/STaR/020/2013, CIRg13nov032, NMRC/MOHIAFCAT1-6003 and NMRC/MOHIAFCAT2/005/2015), the A*STAR Biomedical Research Council-Economy Development Board (BMRC-EDB IAF: IAF311020 and SPF2014/005) and Duke-NUS and SingHealth. MH was supported by an ERC CoG grant (HepatoMetaboPath) and the SFB 179 and 209.
Competing interests None declared.
Patient consent Obtained.
Ethics approval Centre IRB.
Provenance and peer review Not commissioned; externally peer reviewed.