Article Text

Abstract
Objective The initial steps of pancreatic regeneration versus carcinogenesis are insufficiently understood. Although a combination of oncogenic Kras and inflammation has been shown to induce malignancy, molecular networks of early carcinogenesis remain poorly defined.
Design We compared early events during inflammation, regeneration and carcinogenesis on histological and transcriptional levels with a high temporal resolution using a well-established mouse model of pancreatitis and of inflammation-accelerated KrasG12D-driven pancreatic ductal adenocarcinoma. Quantitative expression data were analysed and extensively modelled in silico.
Results We defined three distinctive phases—termed inflammation, regeneration and refinement—following induction of moderate acute pancreatitis in wild-type mice. These corresponded to different waves of proliferation of mesenchymal, progenitor-like and acinar cells. Pancreas regeneration required a coordinated transition of proliferation between progenitor-like and acinar cells. In mice harbouring an oncogenic Kras mutation and challenged with pancreatitis, there was an extended inflammatory phase and a parallel, continuous proliferation of mesenchymal, progenitor-like and acinar cells. Analysis of high-resolution transcriptional data from wild-type animals revealed that organ regeneration relied on a complex interaction of a gene network that normally governs acinar cell homeostasis, exocrine specification and intercellular signalling. In mice with oncogenic Kras, a specific carcinogenic signature was found, which was preserved in full-blown mouse pancreas cancer.
Conclusions These data define a transcriptional signature of early pancreatic carcinogenesis and a molecular network driving formation of preneoplastic lesions, which allows for more targeted biomarker development in order to detect cancer earlier in patients with pancreatitis.
- PANCREATIC CANCER
- SIGNAL TRANSDUCTION
Statistics from Altmetric.com
Significance of this study
What is already known on this subject?
Pancreatitis is a significant risk factor for pancreatic ductal adenocarcinoma (PDAC).
Adult acinar cells are susceptible to oncogenic Kras in the presence of acute or chronic inflammation in animal models.
Distinct morphological entities, such as acinar-to-ductal metaplasia, atypical flat lesions and pancreatic intraepithelial neoplasia, are putative precursor lesions of PDAC.
What are the new findings?
Three phases of pancreatic inflammation and regeneration have been identified, which correspond to different waves of proliferation of mesenchymal, progenitor-like and acinar cells.
Pancreas regeneration requires a coordinated proliferation transition between mesenchymal, progenitor-like and acinar cells, whereas early carcinogenesis is characterised by persistent and parallel proliferation of these cell types.
Adult acinar cells prior to ‘proliferative transition’ are permissive to form preneoplastic lesions induced by oncogenic Kras, whereas they are refractory after proliferative transition.
How might it impact on clinical practice in the foreseeable future?
We introduce a concept of molecular tissue dynamics in early pancreatic carcinogenesis that extends beyond descriptive morphology.
Tissue-based networks may be translated into liquid biopsy findings for stratification of PDAC patients.
Definition of altered molecular networks during carcinogenesis will allow for a more concise definition of biomarker targets for early pancreas cancer detection in risk groups.
Introduction
The causes and development of the deadly disease, pancreatic ductal adenocarcinoma (PDAC), are barely understood.1 Pancreatitis is an established significant risk factor for PDAC.2 Oncogenic Kras mutations (eg, KrasG12D) are considered as critical genetic events in early pancreatic carcinogenesis and are found in approximately 90% of patients with PDAC.3 In mouse models, activation of oncogenic Kras (eg, KrasG12D) in the pancreatic epithelial lineage during embryogenesis invariably produces pancreatic preneoplastic lesions that in one-third of animals develop into invasive tumours in adulthood.4 In comparison, mature pancreatic epithelial cells are mostly refractory to transformation following activation of oncogenic Kras.5 It has also been demonstrated that Kras mutations appear in the pancreas of healthy individuals.6 This supports the hypothesis that oncogenic Kras alone is not sufficient to induce carcinogenesis, and that a transformation-permissive inflammatory environment is prerequisite. Epithelial cells in adult mouse pancreas have consistently been shown to be susceptible to oncogenic Kras-mediated transformation in the presence of acute or chronic inflammation.7 ,8 This seems to be a result of multidimensional interactions between the inflammatory microenvironment and oncogenic Kras.9–11
We, therefore, analysed the pancreatitis-driven creation of an early carcinogenesis-permissive environment in detail. To this end, oncogenic and inflammatory processes were assessed at high temporal resolution on histological and transcriptional levels. In parallel, the proliferation of different pancreatic cellular compartments was determined, enabling the identification of molecular networks underlying early carcinogenesis in the pancreas.
Methods
Mouse lines
P48cre/+; LSL-KrasG12D/+ mice (hereafter referred to as ‘KrasG12D mice’) were generated by crossing a strain containing the Loxp-STOP-Loxp-KrasG12D (LSL-KrasG12D; 008179) gene with mice carrying the pancreas-specific Cre recombinase Ptf1aCre/+ (also known as p48Cre/+), courtesy of Professor Roland M Schmidt and Jens T Siveke (Department of Gastroenterology, TU Munich). Elastase-CreERT2 (008861), mosaic analysis with double marker (MADM)-11TG (013751), MADM-11GT (013749) and p53flox/flox (008462) obtained from Jackson Laboratory (Bar Harbor, USA) wild-type mice (WT; C57BL/6J) were obtained from Charles River Laboratory (Sulzfeld, Germany).
Caerulein treatment
Acute pancreatitis in WT (C57BL/6J) and KrasG12D/+ (p48cre/+; LSL-KrasG12D/+) mice was induced at 8–9 weeks of age by administering caerulein according to the previously described ‘consecutive’ protocol.12 Caerulein treatment was administered through eight hourly intraperitoneal (i.p.) injections (2 mg per injection) on two consecutive days. Control mice were treated accordingly using 0.9% NaCl solution. The time point of the last injection was considered hour 0 and the day of the last injection was considered day 0. Control animals were sacrificed 1 hour after receiving injections. Mice were injected with 2.5 mg BrdU i.p. 2 hours before sacrifice.
Statistical analysis
GraphPad Prism V.5 (GraphPad, San Diego, California, USA) was used for the statistical analysis. Unless otherwise stated, an unpaired Student's t-test was used to compare groups. Statistical significance was set at p <0.05. Results are expressed as mean with SD, unless indicated otherwise.
Additional materials and methods
A detailed Materials and Methods section is provided as an online supplement to this manuscript.
Results
Temporal course of acute pancreatitis: inflammation, regeneration and refinement
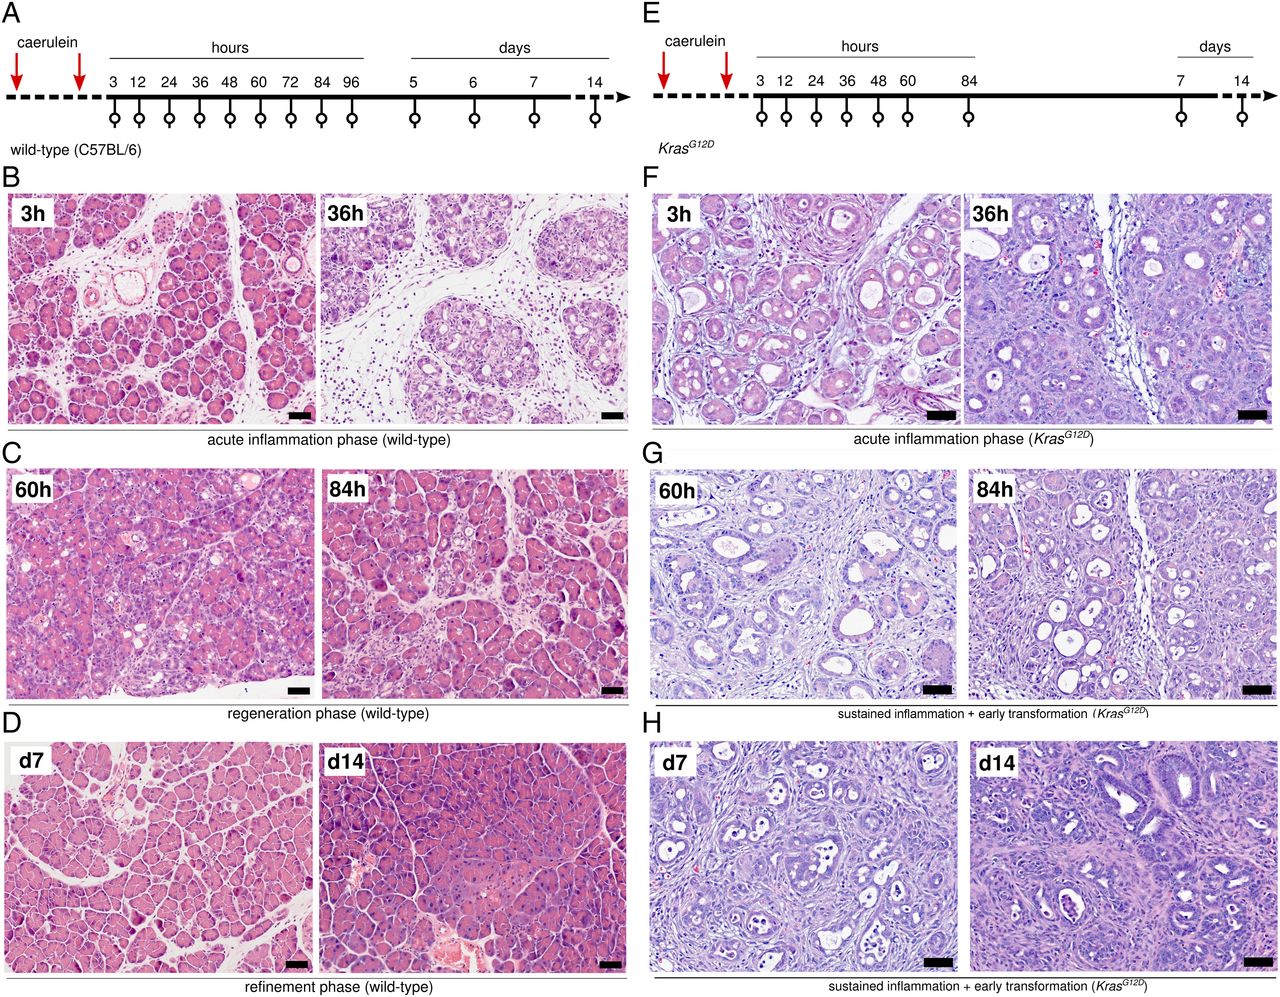
To investigate the experimentally induced inflammatory response of the pancreas, we induced moderate acute pancreatitis in mice, as reported above.12 ,13 Because the temporal resolution of histological description and molecular characterisation in previous studies is low,14 we analysed histological changes and transcriptional profiles at a multitude of time points (figure 1A, summarised in online supplementary table S1, S2 and figure S1). Histological analysis revealed that acute pancreatitis is a self-resolving process, which can be divided into three phases: acute inflammation (from 3 to 36 hours), regeneration (from day 2 to 6) and refinement (from day 7 to 14). All samples were assigned post hoc to the respective phases. At 3 hours, pancreata were oedematous and infiltrated by immune cells (figure 1B). Vacuolisation of acinar cells with scattered apoptotic cells was observed. Formation of acinar-to-ductal metaplasia (ADM) or tubular complexes was initiated. As the inflammatory process progressed, immune cell infiltration and ADM formation became more pronounced (figure 1B). This process was completed at 36 hours, when atrophic acini and ADM lesions with apoptosis were observed in the pancreatic parenchyma. Thereafter, histological changes compatible with organ regeneration appeared (figure 1C). From day 2 onwards, immune cell infiltration began to resolve; ADM lesions slowly disappeared and regular pancreatic parenchyma was gradually re-established. On day 6, only minimal inflammation, focal atrophic acini and ADM were seen. From day 7 to 14, organ regeneration was almost complete and residual inflammation resolved (figure 1D). This final phase was termed tissue refinement.

Cerulein injections in wild-type (WT) mice are followed by inflammation, regeneration and refinement, whereas the inflammatory response in KrasG12D mice is a non-resolving process, leading to early carcinogenesis. (A) WT mice were sacrificed between 3 hours and 14 days after 2 days of consecutive caerulein injections. (B–D) Representative H&E-stained sections with histological features of the inflammation, regeneration and refinement phases in WT pancreata (scale bars: 50 µm). (E) KrasG12D mice were sacrificed between 3 hours and 14 days after 2 days of consecutive caerulein injections. (F–H) Representative H&E-stained sections with histological features of persistent inflammation during the different phases (3–36 hours, 48 hours—day 7 and day 7–14) in KrasG12D pancreata; scale bars: 50 µm.
Impairment of regeneration and refinement in mice harbouring oncogenic Kras
Similarly, pancreatitis was induced in 8-week-old KrasG12D/+ mice and organs were collected at nine time points (figure 1E, summarised in online supplementary table S1 and S3). As previously recorded, only low-grade pancreatic intraepithelial neoplasia (PanIN) lesions were detected in control mice. In contrast to WT mice, no clear histological phases of pancreatitis could be identified. Within the first 36 hours, histological patterns of KrasG12D mice were similar to those of WT mice (figure 1F). Yet, in line with the published data,12 ,13 no clear organ regeneration was observed. Particularly, ADM lesions remained in their ductal phenotypes. Immune cell infiltration persisted and progression of lobular fibrosis was noted (figure 1G). On days 7 and 14, putative precursor lesions of PDAC—atypical flat lesions15 and PanINs—were observed in atrophic areas (figure 1H). Thus, pancreatitis in the presence of oncogenic KrasG12D proceeds without clear histological phases, as compared with the sequence of events in WT mice.
Contribution of the different pancreatic cellular compartments to regeneration and early carcinogenesis
We then determined the proliferation of different cellular compartments during the course of pancreatitis. First, the index of proliferating cells (BrdU-positive) and the number of immune cells (Cd45-positive) over time was determined in WT and KrasG12D mice. Two distinctive waves of proliferation were found in WT mice (figure 2A, B, left panel). The first wave corresponded exactly with the time frame of the inflammation phase, whereas the second coincided with the regeneration phase. In KrasG12D mice, however, no clear segmentation of proliferation was found (figure 2A, B, right panel). Immune cell infiltration in WT mice increased dramatically in the inflammatory phase and then slowly decreased during regeneration and refinement (figure 2C, D, left panel). In contrast, in KrasG12D animals, the number of Cd45-positive cells steadily increased, indicating a non-resolving immune response (figure 2C, D, right panel).
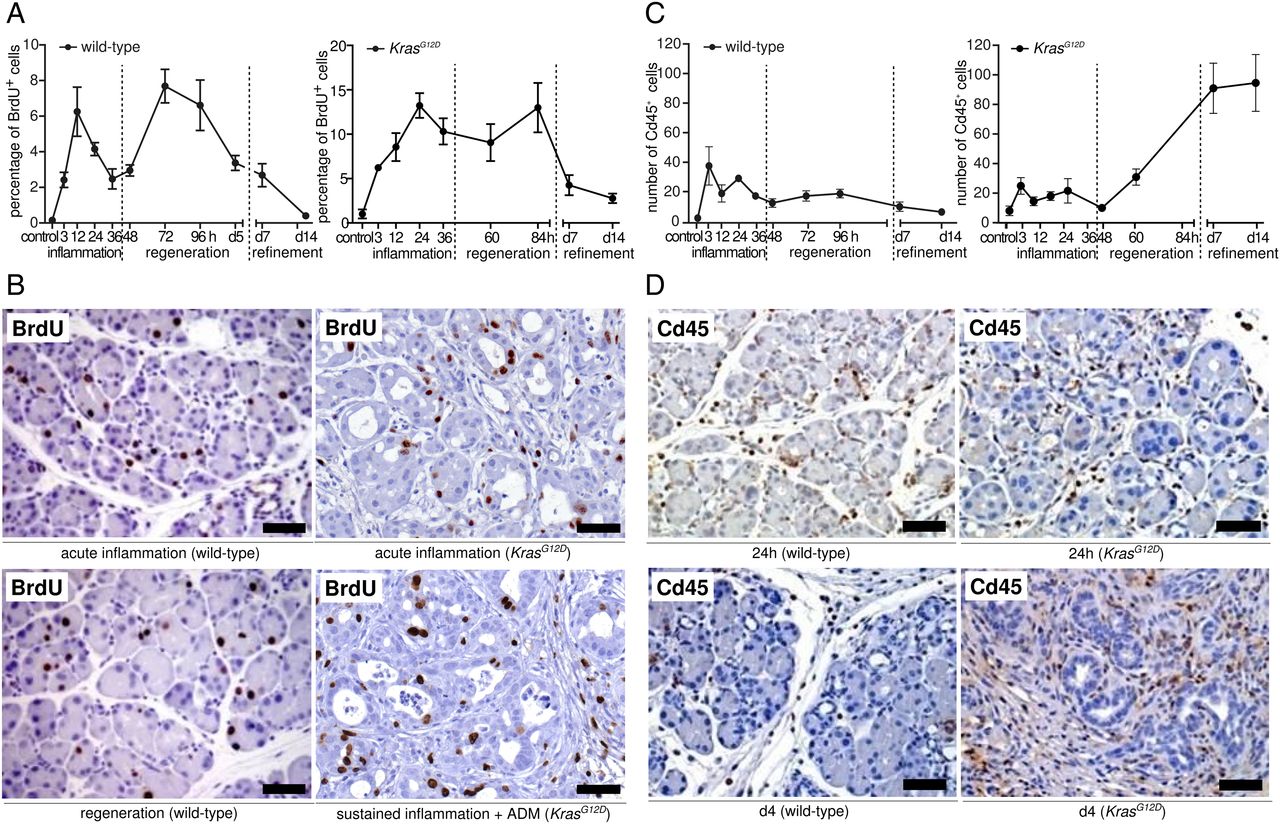
Quantitative analysis of proliferation and immune cell infiltration in acute pancreatitis and early carcinogenesis. (A) Proliferation index in wild-type (WT) and KrasG12D pancreata in different phases of inflammation, as obtained by quantifying the percentage of BrdU-positive cells and haematoxylin-counterstained nuclei. (B) Representative IHC pictures show BrdU-positive cells in the different phases of inflammation in WT (left panel) and KrasG12D pancreata (right panel); scale bars: 50 µm. (C) Quantitative data show time-dependent changes in the number of Cd45-positive cells in the different phases in WT and KrasG12D pancreata. (D) Representative IHC pictures show Cd45-positive cells in the different phases of inflammation in WT (left panel) and KrasG12D pancreata (right panel); scale bars: 50 µm.
Costainings of BrdU with specific markers for pancreatic acinar (α-amylase), progenitor-like (Sox9 and Pdx1) and mesenchymal (α-smooth muscle actin (SMA)) cells enabled cell-type-specific quantification of proliferation. For acinar cells, we observed two waves of cell replication in WT pancreata (figure 3A–C). The overall number and percentage of proliferating acinar cells during the regeneration phase were higher than in the inflammatory phase (p<0.0001; t-test, see online supplementary figure S2A). In the presence of oncogenic KrasG12D, however, proliferation of acinar cells was comparable to that in WT pancreata during the first 36 hours (ie, corresponding to the WT inflammation phase, figure 3A–C)—while subsequently it was significantly lower (p=0.0001; t-test, see online supplementary figure S2A). Mature acinar cells transiently adopt a progenitor state that allows for rapid repopulation of the exocrine compartment following inflammatory injury.12 ,16 Our analysis revealed that in WT mice, Sox9-positive progenitor-like cells mainly proliferated during the inflammatory phase, whereas the number and percentage of proliferative Sox9-positive cells were constantly high in KrasG12D pancreata (figure 3D–F, see online supplementary figure S2B). Similar results were obtained when Pdx1 was used to label cells with progenitor features (see online supplementary figures S2C and S3). Because pancreatic injury is linked with expansion of resident fibroblasts—known as activated fibroblasts17 ,18—we quantified the number of such proliferating cells. In response to injury, activated fibroblasts proliferated and expressed α-SMA. Interestingly, we observed that proliferation of α-SMA-positive cells was strictly limited to the inflammatory phase in WT pancreata and that the magnitude of proliferation was relatively low. In contrast, proliferation of α-SMA-positive cells in KrasG12D samples was more persistent and more prominent (figure 3G–I, see online supplementary figure S4).
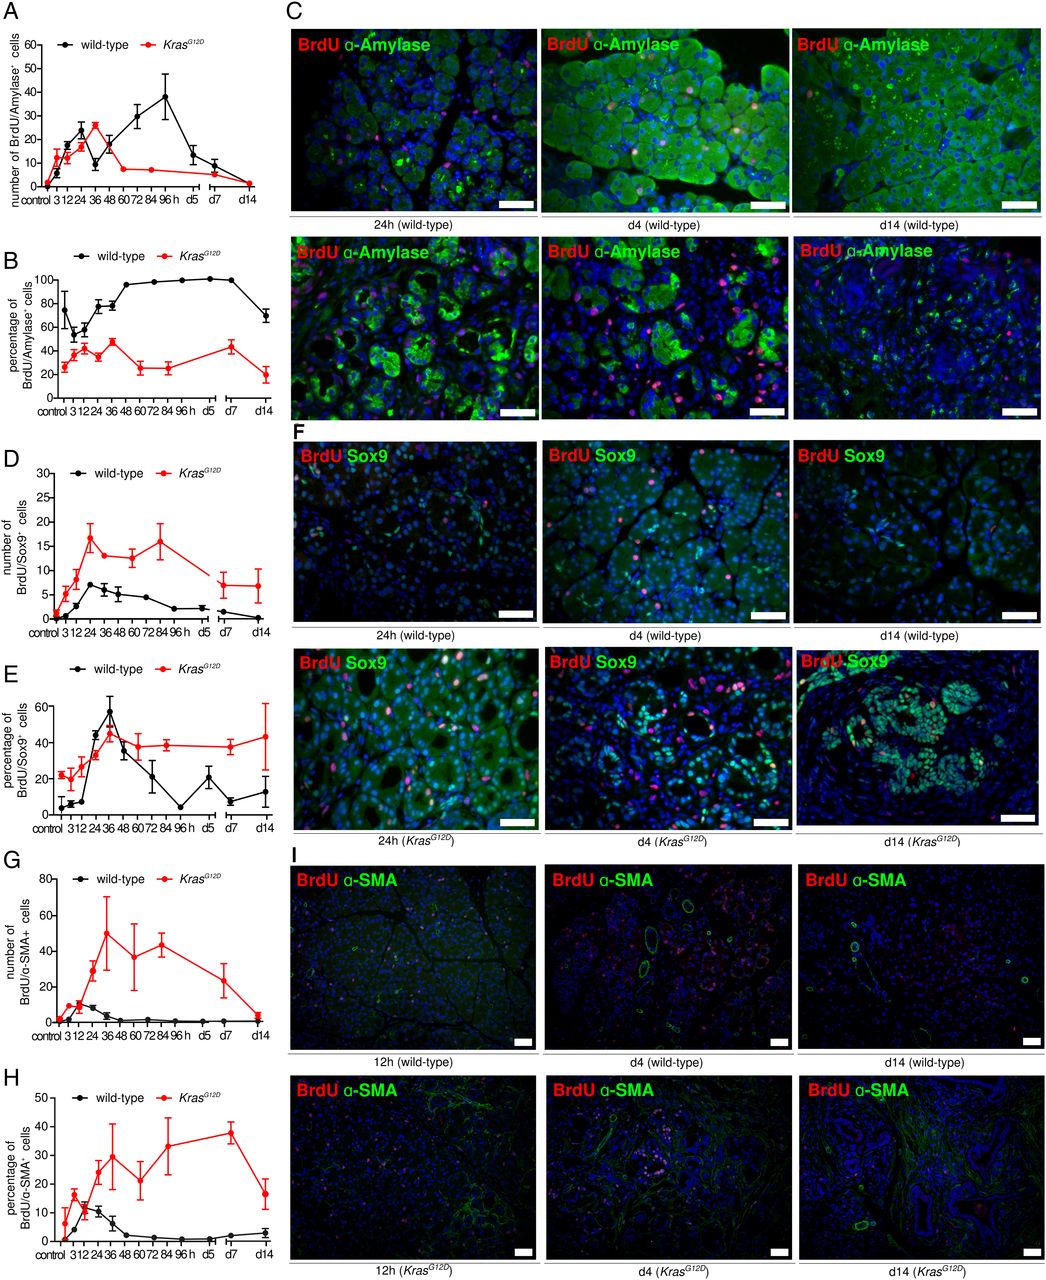
Dissection of proliferative components in acute pancreatitis and early carcinogenesis. (A and B) Number and percentage of proliferating α-amylase-positive cells in wild-type (WT) and KrasG12D pancreata. (C) Representative immunofluorescence (IF) of proliferating α-amylase-positive cells in WT (upper panel) and KrasG12D (lower panel) pancreata in different phases of inflammation; scale bars: 50 µm. (D and E) Number and percentage of proliferating Sox9-positive cells in WT and KrasG12D pancreata. (F) Representative IF of proliferating Sox9-positive cells in WT (upper panel) and KrasG12D (lower panel) pancreata in different phases of inflammation; scale bars: 50 µm. (G and H) Number and percentage of proliferating α-SMA-positive cells in WT and KrasG12D pancreata. (I) Representative IF of proliferating α-SMA-positive in WT (upper panel) and KrasG12D (lower panel) pancreata in different phases of inflammation; scale bars: 50 µm.
Supplemental material
Unbiased assessment of transcriptional profiles of inflammation, regeneration and early carcinogenesis
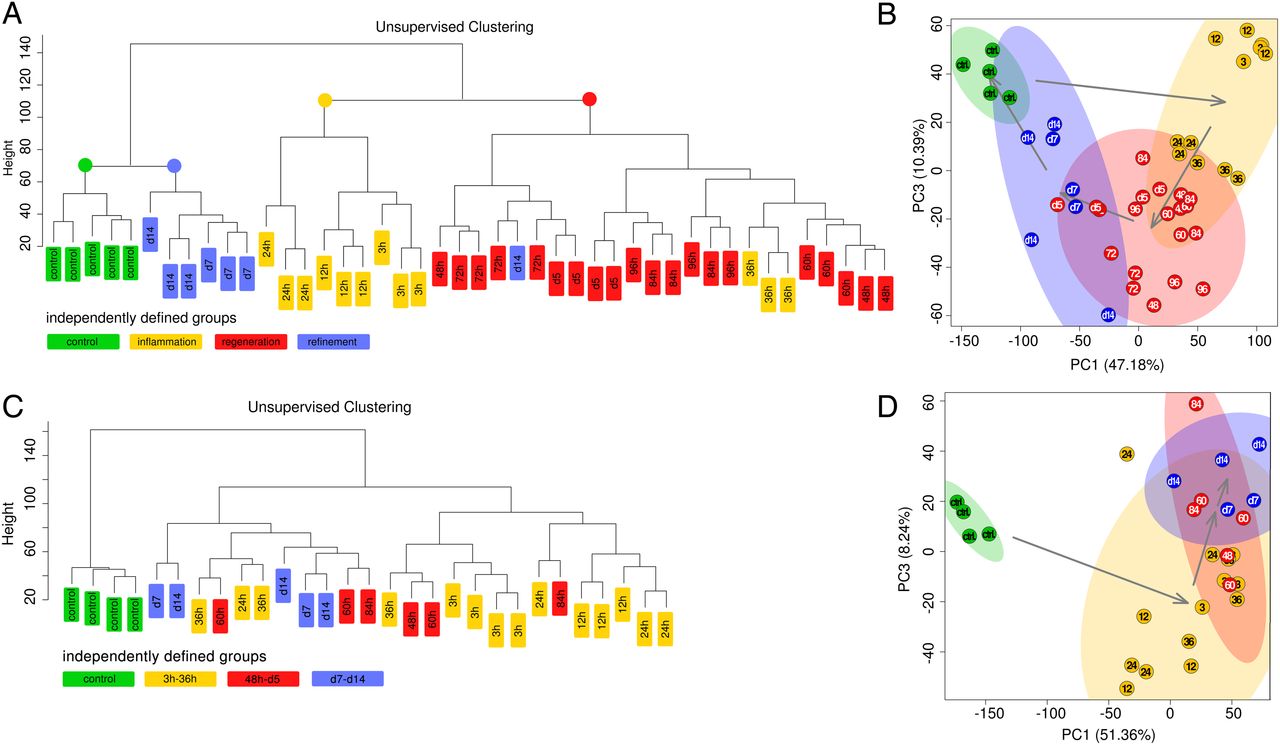
To test whether these histological phases were reflected at gene expression levels, we performed unsupervised clustering of microarray-based transcriptome data of bulk pancreatic tissues. WT samples clustered according to histological observations (figure 4A; four distinct clusters). Principal component analysis (PCA) revealed that the three phases followed a cyclic pattern (control—inflammation—repair—refinement—control) (figure 4B). In contrast, unsupervised clustering of transcriptional profiles from KrasG12D/caerulein pancreata failed to identify prominent subclusters, which is consistent with the lack of distinct histological phases during pancreatitis in KrasG12D mice. All transcriptome profiles of KrasG12D pancreata after caerulein treatment formed one heterogeneous cluster, distinct from untreated KrasG12D controls (figure 4C). PCA confirmed heterogeneity and underscored dissimilarity between control and late-stage samples in KrasG12D mice (figure 4D). Quantitative reverse transcriptase PCR and immunohistochemistry confirmed these findings (see online supplementary figures S5A–S5H and supplementary data for details).

Unbiased assessment of transcriptional profiles of inflammation, regeneration and early carcinogenesis. (A and B) Unsupervised clustering of transcriptional profiles in wild-type (WT) mice: homogeneous clusters correspond to the histologically defined phases (left panel): principal component analysis (PCA) biplot of transcriptional profiles with 95% confidence ellipsoids: the temporal course of inflammation in WT pancreata is a self-resolving process forming a cyclic pattern (as underscored by arrows between the centres of the groups' samples, right panel). (C and D) Clustering of KrasG12D profiles confirms disordered regeneration as indicated by heterogeneous clusters (left panel); PCA biplot confirms that regeneration is blocked in KrasG12D mice (right panel).
Persistent inflammation in KrasG12D mice corresponds to the WT mouse inflammatory phase
To compare transcriptional profiles of WT and KrasG12D mice, we then performed a three-way PARAFAC (canonical polyadic decomposition) analysis. This confirmed the phases in WT acute pancreatitis animals (figure 5A, left panel) as well as their absence in KrasG12D animals (figure 5A, right panel). The transcriptional signatures of KrasG12D mice during 48 hours—day 5 and day 7–14 corresponded to the WT mouse inflammatory phase, showing a persistent inflammatory status. An inflammatory signature consisting of 143 genes was generated for validation (for details, see supplementary ‘data/methods’). Here, all KrasG12D samples treated with caerulein clustered with the samples of the inflammatory phase of WT mice (see online supplementary figures S6A). This inflammatory signature was also found in full-blown murine PDAC (data retrieved from publicly available datasets (GSE33323), see online supplementary figure S6B).
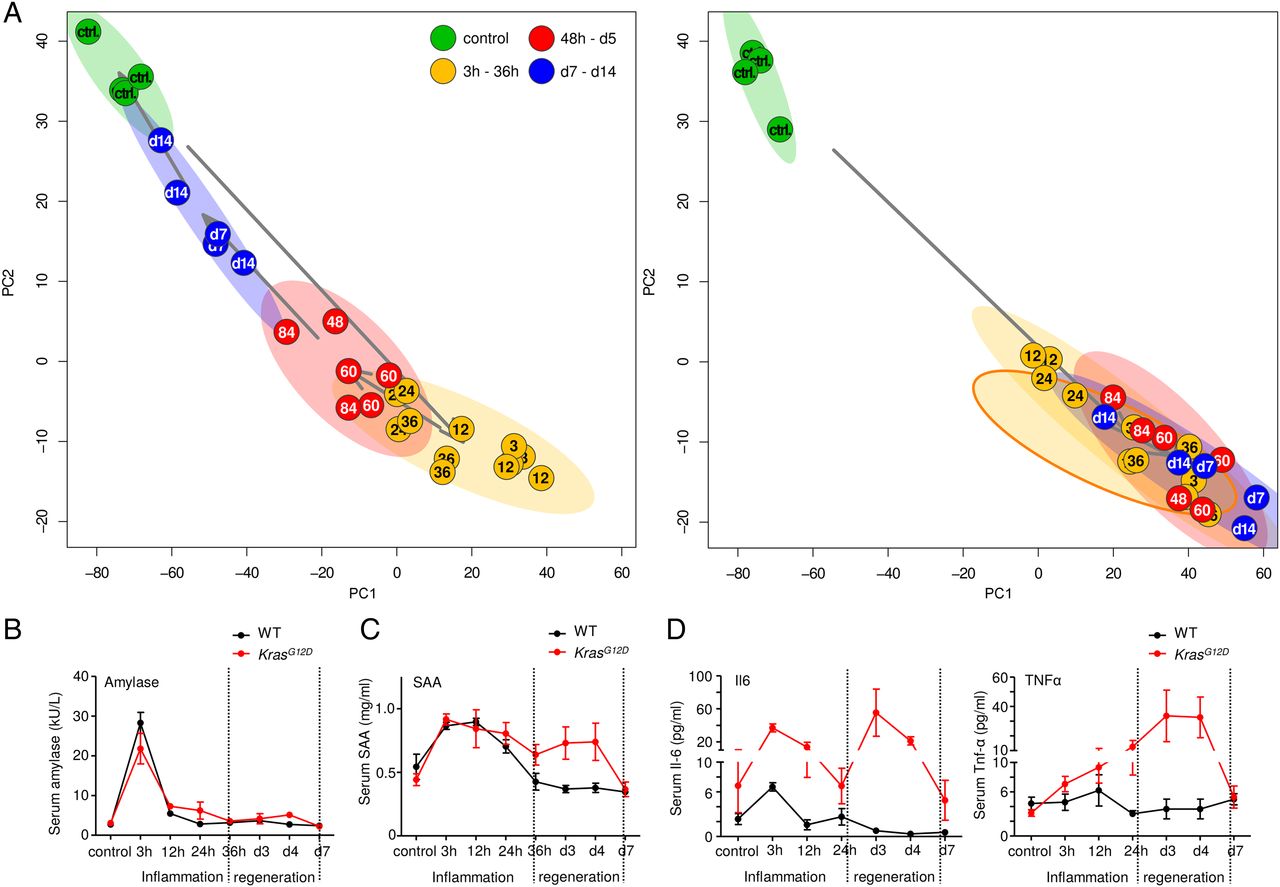
Persistent inflammation in KrasG12D mice corresponds to the wild-type (WT) mouse inflammatory phase. (A) PARAFAC analysis: direct comparison of transcriptional profiles of WT and KrasG12D pancreata on a genome-wide scale; 95% confidence ellipsoids reflect the previously defined phases; all samples from KrasG12D mice (except for controls) are highly similar to the inflammation phase in WT mice. (B–D) Serum measurements show the time-dependent changes in the level of serum amylase, SAA, interleukin 6 and tumour necrosis factor α in the different phases in WT and KrasG12D pancreata.
We measured the serum level of a number of inflammatory markers to investigate if this persistent inflammatory status was also reflected at the systemic level. No difference in the serum levels of amylase and lipase in WT and KrasG12D mice was observed (figure 5B and see online supplementary figure S7A). Serum amyloid A (SAA, a general inflammatory marker) was induced during the inflammation phase in WT mice; however, its induction in KrasG12D mice was persistent during 36 hours—day 5 (figure 5C, see online supplementary figure S7B). Similar results were obtained when serum levels of C-reactive protein (see online supplementary figure S7C), interleukin 6 (figure 5D) and tumour necrosis factor α (figure 5D) were measured.
Transcriptional confirmation of tissue dynamics in proliferative components
Based on our histological data of the dynamic proliferation of acinar cells, we hypothesised that the molecular machinery governing the exocrine programme may exhibit a similar pattern. We extracted a list of 61 ‘acinar cell homeostasis’ genes from the literature to test this hypothesis.19–24 The kinetics of expression of these genes during different phases of inflammation and KrasG12D-driven early carcinogenesis was analysed (see online supplementary table S4 and figure S8A, S8B19–23). Eleven of 61 genes were differentially expressed between inflammatory and regeneration phase and control samples in WT mice (adjusted p<0.05, absolute fold change (FC)>2, two independent t-tests, online supplementary table S5, figure 6A, left panel; proportion (11/61) was significantly higher than expected for a random gene set (hypergeometric test: p=5.98×10⁻¹⁰)).

Transcriptional confirmation of tissue dynamics in proliferative components. (A) Heatmap of 11 genes linked to acinar cell homeostasis as indicated on the right; voxel colour: transcriptional upregulation (red) and downregulation (blue) as compared with the mean; each voxel indicates gene activity in one mouse sample arranged in chronological order; coloured bar indicates control (green) and regenerative phases (yellow, red and blue). (B) Bioinformatic analysis of the activity of the entire gene regulatory network of pancreatic organogenesis in different phases of inflammation in wild-type (WT; left panel) and KrasG12D (right) pancreata identified two active subcircuits: Ptf1a-Rbpj/Rbpjl-Nkx6.1 and Hes1-Sox9-Onecut1-Hnf1b-Neurog3. (C) Phase contrast picture shows the metaplastic lesions formed by KrasG12D-acinar cells in three-dimensional (3D) culture (lower panel); upper panel: freshly isolated WT acinar cells; scale bar: 100 µm; (D) Quantitative reverse transcriptase PCR data show the expression of Amy1, Krt19, Rbpjl, Rbpj, Ptf1a and Nkx6-1 in WT acinar cells and metaplastic lesions formed by KrasG12D-acinar cells in 3D culture; relative expression obtained from at least three independent experiments, *p<0.05. (E) Heatmap of Ptf1a, Rbpj, Rbpjl and Nkx6-1 in WT pancreas and 28 murine KrasG12D-expressing pancreatic cancer cell lines; voxel colour: transcriptional upregulation (red) and downregulation (blue) as compared with the mean.
It has been previously demonstrated that elements of embryonic development are recapitulated during organ regeneration in adult animals.25 Thus, we hypothesised that gene regulatory networks (GRNs) governing organ development might be partially active in our model. To test this, we extracted a previously compiled transcription factor GRN governing the embryonic development of the exocrine pancreas.26 This GRN was then used to identify subcircuits influencing progenitor expansion during the inflammatory phase and in KrasG12D-driven early carcinogenesis (see online supplementary figure S8C). The analysis identified two active subcircuits in both WT and KrasG12D samples: Ptf1a-Rbpj/Rbpjl-Nkx6.1 and Hes1-Sox9-Onecut1-Hnf1b-Neurog3 (figure 6B, left panel: WT; right panel: KrasG12D). These changes seem to provide continuous proliferating signals for progenitor-like cells during early carcinogenesis. We performed three-dimensional (3D)-culture assays using KrasG12D-expressing acinar cells, which formed proliferative ductal structures reminiscent of ADM/PanIN lesions in vivo (figure 6C) to test this.27 We were not able to establish 3D culture conditions, which would have yielded such structures when acinar cells were isolated from WT pancreata (eg, culture conditions under which ADMs from WT pancreata reinitiated their acinar cell programmes and started to proliferate). Thus, freshly isolated acinar cells were used as controls for the following experiments. Expression analysis of Amy1 and Krt19 confirmed ductal metaplasia (figure 6D). Notably, expression of Ptf1α, Rbpjl and Nkx6-1 in ductal cells was consistently decreased compared with that of WT acinar cells, while the expression of RbpJ was increased (figure 6D) similar to murine KrasG12D-expressing pancreatic cancer cell lines (GSE31150 vs GSE40609, figure 6E).
We then went on to validate the mesenchymal compartment histology data on a transcriptional level. To this end, we extracted a previously characterised in vitro fibroblast activation signature containing 67 genes.28 This analysis revealed that eight of the 67 genes were differentially expressed in the inflammatory phase in WT samples as compared with controls and regeneration-phase samples (p<0.05, FC>2, two independent t-tests, see online supplementary table S5 and figure S8D, S9A, left panel; ratio (8/67), again significantly higher than expected for a random gene set (hypergeometric test: p=2.57×10⁻⁶)). Transient upregulation was seen in the WT inflammatory phase and normalisation in the regeneration phase (see online supplementary figure S9A, left panel). However, all of these showed sustained upregulation in KrasG12D samples treated with caerulein (see online supplementary figure S9A, right panel). As it has previously been demonstrated that sonic hedgehog (SHH) secreted by KrasG12D cells regulates pancreatic fibroblast expansion,29 ,30 we stained KrasG12D pancreata for putative downstream targets of SHH, namely Gli1 and Postn. Mesenchymal cells surrounding neoplastic lesions were consistently positive for Gli1 and Postn (see online supplementary figure S9B, S9C).
In silico modelling of molecular network for organ regeneration and early carcinogenesis
As shown above, the caerulein-induced inflammatory response was characterised by coordinated cell proliferation in the epithelial and mesenchymal compartments, which resulted in a sequential transition from progenitor-like to acinar cells during the transition from inflammation to regeneration. However, this transition to regeneration was lost in early carcinogenesis, where cells remained in a proliferative progenitor-like state reminiscent of the (earlier) inflammatory phase. These data are in line with previous publications where oncogenic Kras in the context of inflammation induced a so-called ‘regeneration block’.12 To delineate the molecular networks underlying these phenotypic observations, we performed in silico modelling of high-resolution expression data from the respective phases in animals with and without oncogenic Kras. A dual model of the caerulein-induced inflammatory response and early pancreatic carcinogenesis was constructed (petri-net, figure 7A). This analysis revealed that the complexity of the network mediating proliferative transition from progenitor-like to acinar cells in WT samples was significantly greater than that maintaining the proliferative progenitor-like status in KrasG12D samples (figure 7B, WT and figure 7C, KrasG12D). In particular, members of fibroblast growth factor signalling (Fgf12, Fgfr1, 2, 3) were identified as the most relevant interacting partners in the WT network. Specifically, Fgfr1 expression was increased during inflammation and normalised during regeneration (see online supplementary figure S10A). Inhibition of Fgfr signalling in AR42J cells promoted expression of a number of exocrine genes including Amy2a3, Bhlha15 and Rbpjl, while recombinant Fgf2 reduced their expression (see online supplementary figure S10B, S10C).
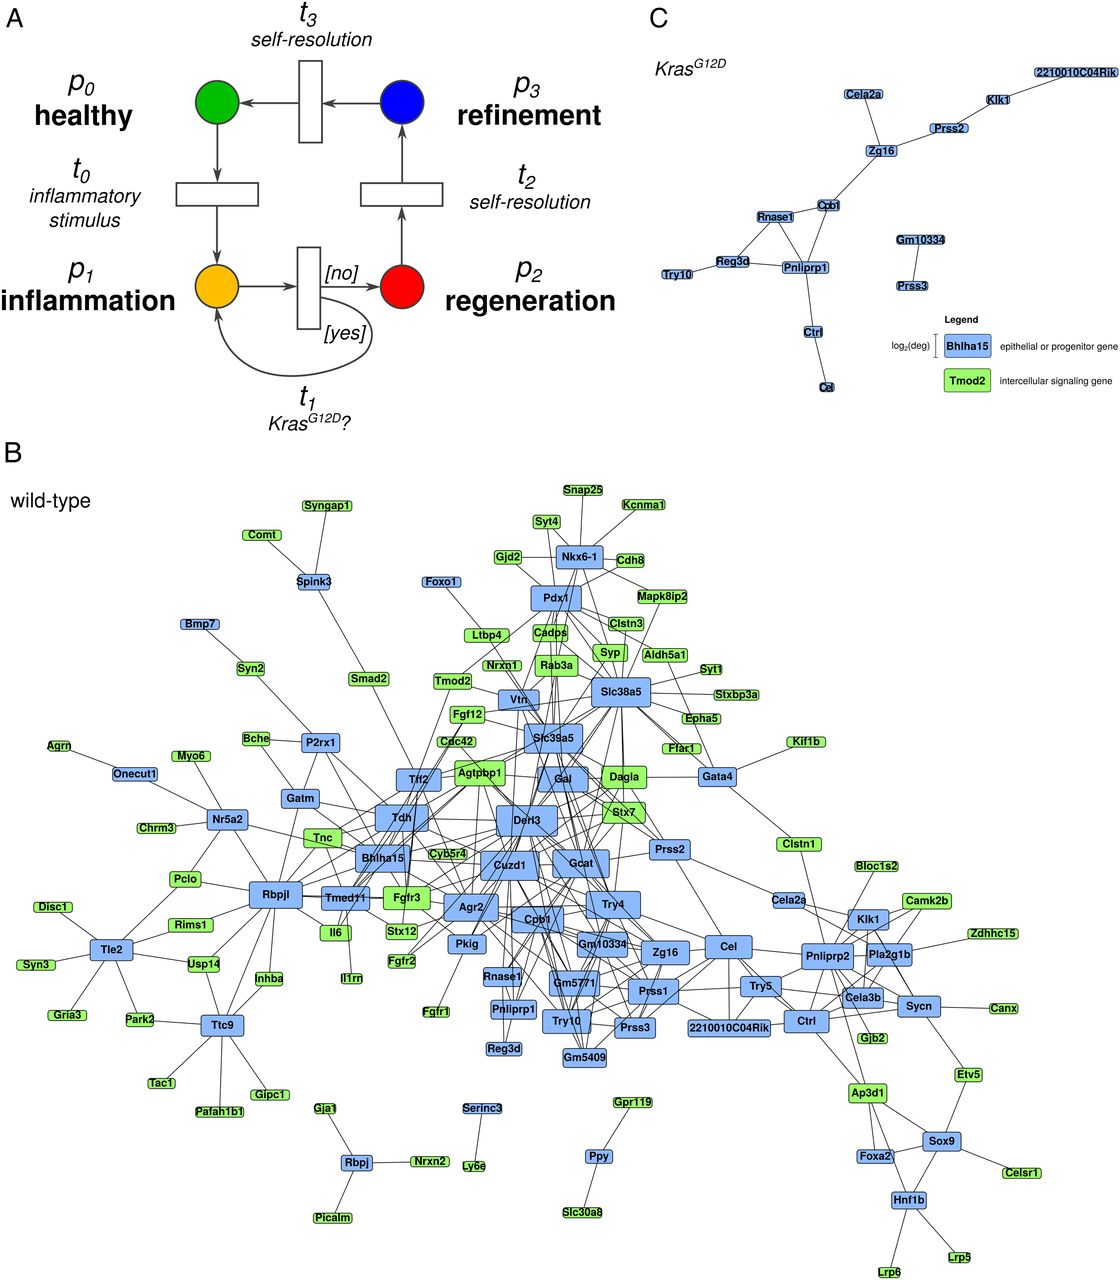
Pancreas regeneration requires activation of a molecular network whose complexity is significantly reduced in early carcinogenesis. (A) The Petri net shows the ‘dual’ in silico model. (B) The modelled molecular network mediating the inflammation-to-regeneration transition in wild-type (WT) mice. (C) The modelled molecular network in KrasG12D mice.
Adult acinar cells cannot be transformed once proliferation transition has started
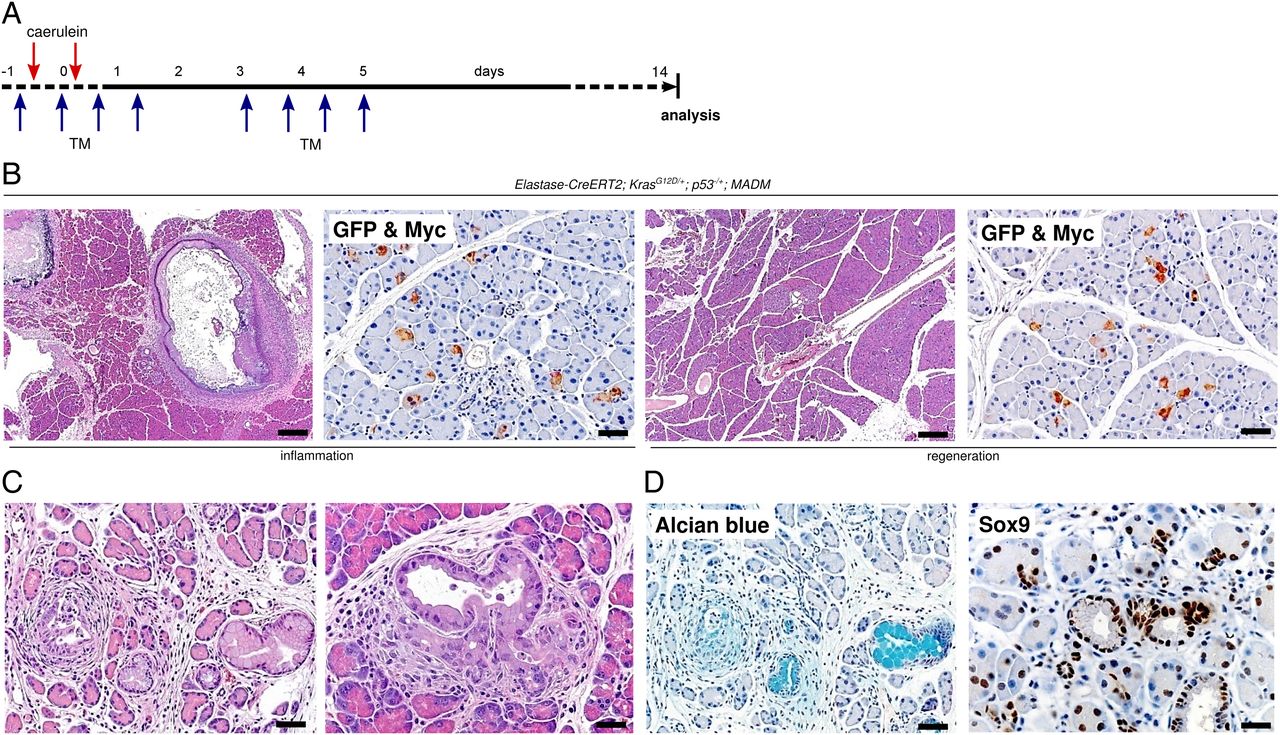
To further determine the role of inflammation in early carcinogenesis and to exclude that oncogenic Kras already expressed during embryogenesis might have confounded the results by providing the environment necessary for formation of preneoplastic lesions, we used an Ela-CreERT2 inducible KrasG12D system and tested susceptibility to develop preneoplastic lesions in the above-described situations (inflammation vs regeneration; figure 8A).31 To concomitantly verify genetic recombination in acinar cells, we implemented a recently described MADM system (see online supplementary figure S11A),32–34 and generated MADM; Elastase-CreERT2; KrasG12D/+; p53fl/+ transgenic mice (hereafter named ‘MEKP’ mice). Recombination was confirmed by immunohistochemistry (IHC) for enhanced green fluorescent protein (EGFP) and Myc Tag (MYC) (figure 8B, see online supplementary figure S11B: double immunofluorescence (IF) for EGFP and MYC). When Cre-mediated KrasG12D expression was induced during the inflammation phase (‘Inflammation-MEKP’), we observed that a large part of the pancreas regenerated by day 14. However, areas of focal unresolved inflammation were noted in all examined pancreatic tissues (figure 8B, left panel). Interestingly, areas of necrosis were seen in 50% (3/6) of the samples (figure 8B, left panel). In contrast, when Cre recombinase was induced during the regeneration phase (‘Regeneration-MEKP’), pancreata completely regenerated and no pathological changes were observed (figure 8B, right panel).
Adult acinar cells cannot be transformed once proliferation transition has started. (A) Schematic illustration shows the experimental set-up for pulsed activation of Cre activity during the inflammation (n=6) and the regeneration (n=4) phase, respectively. (B) Representative H&E-stained and double-IHC-stained (green fluorescent protein and Myc) sections show histology (scale bars: 200 µm) and genetic labelling (scale bars: 50 µm) in Inflammation-MEKP and Regeneration-MEKP mice. (C) Representative H&E-stained sections show focal pancreatic intraepithelial neoplasia (PanIN) lesions in Inflammation-MEKP mice, scale bars: 50 µm (left panel) and 20 µm (right panel). (D) Representative Alcian blue and Sox9-stained sections show expression of mucin and Sox9 in PanIN lesions of Inflammation-MEKP mice, 50 µm (left panel) and 20 µm (right panel).
Notably, close histological examination of Inflammation-MEKP mice revealed that pancreatic cancer precursor lesions such as PanINs had developed in areas with unresolved inflammation (figure 8C). These lesions were mucin-positive, contained proliferating cells, showed distinct stainings for p-Erk and Sox9 and were surrounded by α-SMA-positive mesenchymal cells, reflecting key histological features of early pancreatic carcinogenesis (figure 8D and see online supplementary figure S11C). However, no such lesions were observed in Regeneration-MEKP mice.
Discussion
We provide here for the first time, a detailed analysis of the kinetics of acute pancreatitis and uncover three distinct phases including inflammation, regeneration and refinement. Yet, in the presence of oncogenic KrasG12D this course of inflammation is perturbed and progenitor-like, and mesenchymal cell proliferation (a hallmark of early carcinogenesis) is increased. Our data indicate that regeneration of the pancreas requires a coordinated transition between mesenchymal, progenitor-like and acinar cell proliferation. In silico modelling uncovered molecular interactions mediating the proliferative transition from progenitor-like to acinar cells during organ regeneration, and those maintaining persistent proliferation of progenitor-like cells in early carcinogenesis. Under inflammatory conditions, a relatively simplified molecular network is associated with increased susceptibility to formation of preneoplastic lesions. However, this window of susceptibility closes immediately as the proliferative transition occurs.
A major feature of the complex dynamics in the incipient stage of pancreatic carcinogenesis is the loss of coordinated progenitor-like and acinar cell proliferation. Recent mathematic modelling uncovered that embryonic development of the intestine follows an optimal control theory. This dictates that proliferation of stem/progenitor cells occurs concisely prior to proliferation of functional epithelial cells, and is proven to be the most efficient way to (re)generate the intestinal system.35 In line with these findings, we observed a similar phenomenon in pancreatic regeneration. Yet, this coordinated proliferation of progenitor-like and acinar cells was absent in the presence of KrasG12D and inflammation. Molecular analysis revealed that the peak of proliferation of progenitor-like cells matched perfectly with the loss of maintenance of the exocrine programme in an inflammatory microenvironment. This allowed us to use genes related to acinar cell homeostasis and progenitor-like cell expansion as a backbone to construct in silico networks with high-resolution temporal profiles. This analysis revealed that the proliferative transition during pancreatic regeneration required diverse and complex molecular interactions, which involve extrinsic/intrinsic signalling proteins and receptors. This complex molecular network constitutes a fine-tuning force, which sustains cell proliferation and maintenance of acinar cell fate. On the other hand, the complexity and diversity of the molecular network required for maintaining the proliferative status of progenitor-like cells in early carcinogenesis were reduced. This simplified interaction network appears to be the backbone of PDAC initiation. On a functional level, it will be important to clarify how the complex network needed for acinar cell proliferation neutralises the transforming effect of oncogenic Kras.
In conclusion, based on the cross-validated quantitative histological data and transcriptional analysis with high-temporal resolution, we characterised complex dynamics of the incipient stage of KrasG12D-driven, inflammation-accelerated pancreatic carcinogenesis. This is characterised by persistent inflammation and a loss of coordinated cell proliferation both in ‘different’ (eg, mesenchymal cells vs epithelial) and ‘similar’ lineages (eg, progenitor-like vs acinar). Such studies will allow for a better definition of early stages of PDAC and thus for the design of future biomarker and prevention studies in populations at high risk for pancreatic cancer. A better understanding of the early steps of pancreatic carcinogenesis in models of the human disease would help define preneoplastic conditions and would allow for risk stratification and potential early detection.
Acknowledgments
We would like to thank Manja Thorwirth, Nadja Maeritz, Isabell Schaeffer, Nadine Wagner and Anke Bettenbrock for excellent technical support and Simone Benitz for providing the 3D cell culture protocol.
References
Footnotes
BK, PB and NAB contributed equally.
Contributors BK, FJT, ME, IE, JK and CWM designed the study. BK, NAB, SF, LC, JC, AG, NV, ZJ, IR and SR performed experiments and acquired data. AMS and IE provided expertise in pathological analysis. PB, MI, JB, NSM and FJT performed bioinformatic analysis and provided expertise in experimental genetics. BK, PB, SR, NAB and CWM drafted the manuscript. ME, HF, JK, JR, TH, IE and FJT revised the manuscript critically for important intellectual content. All authors approved the final version of the manuscript.
Funding This project was supported in part by a grant of the Deutsche Forschungsgemeinschaft (MI 1173/5-1, to CWM, BK and JK), the European Union (FP7, PacaNet), the Else-Kröner-Fresenius-Stiftung (2009_A146, to CWM, BK and JK), the European Research Council (Latent Causes: 259294 to FJT), Federal Ministry of Education and Research (LungSys: FKZ 0316042 to NSM) and of the Helmholtz Portfolio Theme ‘Metabolic Dysfunction and Common Disease’ (JB) and the Helmholtz Alliance ‘Imaging and Curing Environmental Metabolic Diseases, ICEMED’ (JB). This work was supported by research grants from the Helmholtz Alliance Preclinical Comprehensive Cancer Center (PCCC), the DFG (SFB 1054 and RU 695/6-1) and the ERC (FP7, grant agreement No. 322865) to JR.
Competing interests None declared.
Ethics approval Local authority (Regierung von Oberbayern).
Provenance and peer review Not commissioned; externally peer reviewed.
Transcript profiling Microarray data have been submitted to GEO (GSE65146). The following link has been created to allow for review: http://www.ncbi.nlm.nih.gov/geo/query/acc.cgi?token=ijarkuqktpqzlej&acc=GSE65146.